
|
Welcia Holdings Co., Ltd. (3141.T) DCF Valuation |
Fully Editable: Tailor To Your Needs In Excel Or Sheets
Professional Design: Trusted, Industry-Standard Templates
Investor-Approved Valuation Models
MAC/PC Compatible, Fully Unlocked
No Expertise Is Needed; Easy To Follow
Welcia Holdings Co., Ltd. (3141.T) Bundle
Streamline your analysis and improve precision with our (3141T) DCF Calculator! Utilizing real-time data from Welcia Holdings Co., Ltd. and customizable assumptions, this tool enables you to forecast, analyze, and evaluate (3141T) like a seasoned investor.
Discounted Cash Flow (DCF) - (USD MM)
| Year | AY1 2021 |
AY2 2022 |
AY3 2023 |
AY4 2024 |
AY5 2025 |
FY1 2026 |
FY2 2027 |
FY3 2028 |
FY4 2029 |
FY5 2030 |
|---|---|---|---|---|---|---|---|---|---|---|
| Revenue | 949,652.0 | 1,025,947.0 | 1,144,278.0 | 1,217,339.0 | 1,285,005.0 | 1,395,373.5 | 1,515,221.5 | 1,645,363.2 | 1,786,682.6 | 1,940,140.0 |
| Revenue Growth, % | 0 | 8.03 | 11.53 | 6.38 | 5.56 | 8.59 | 8.59 | 8.59 | 8.59 | 8.59 |
| EBITDA | 58,714.0 | 61,981.0 | 68,861.0 | 65,447.0 | 53,311.0 | 77,490.2 | 84,145.8 | 91,373.0 | 99,221.0 | 107,743.0 |
| EBITDA, % | 6.18 | 6.04 | 6.02 | 5.38 | 4.15 | 5.55 | 5.55 | 5.55 | 5.55 | 5.55 |
| Depreciation | 16,975.0 | 18,961.0 | 23,225.0 | 24,392.0 | 26,248.0 | 27,102.8 | 29,430.6 | 31,958.4 | 34,703.3 | 37,684.0 |
| Depreciation, % | 1.79 | 1.85 | 2.03 | 2 | 2.04 | 1.94 | 1.94 | 1.94 | 1.94 | 1.94 |
| EBIT | 41,739.0 | 43,020.0 | 45,636.0 | 41,055.0 | 27,063.0 | 50,387.4 | 54,715.1 | 59,414.6 | 64,517.7 | 70,059.1 |
| EBIT, % | 4.4 | 4.19 | 3.99 | 3.37 | 2.11 | 3.61 | 3.61 | 3.61 | 3.61 | 3.61 |
| Total Cash | 51,918.0 | 23,401.0 | 32,854.0 | 30,533.0 | 35,011.0 | 44,238.6 | 48,038.2 | 52,164.2 | 56,644.6 | 61,509.7 |
| Total Cash, percent | .0 | .0 | .0 | .0 | .0 | .0 | .0 | .0 | .0 | .0 |
| Account Receivables | 44,820.0 | 49,709.0 | 54,266.0 | 63,166.0 | 68,344.0 | 69,251.3 | 75,199.3 | 81,658.1 | 88,671.7 | 96,287.7 |
| Account Receivables, % | 4.72 | 4.85 | 4.74 | 5.19 | 5.32 | 4.96 | 4.96 | 4.96 | 4.96 | 4.96 |
| Inventories | 103,283.0 | 116,230.0 | 128,835.0 | 137,092.0 | 149,011.0 | 157,179.7 | 170,679.8 | 185,339.4 | 201,258.2 | 218,544.1 |
| Inventories, % | 10.88 | 11.33 | 11.26 | 11.26 | 11.6 | 11.26 | 11.26 | 11.26 | 11.26 | 11.26 |
| Accounts Payable | 150,388.0 | 133,524.0 | 153,182.0 | 159,865.0 | 168,758.0 | 191,174.0 | 207,593.8 | 225,424.0 | 244,785.5 | 265,810.1 |
| Accounts Payable, % | 15.84 | 13.01 | 13.39 | 13.13 | 13.13 | 13.7 | 13.7 | 13.7 | 13.7 | 13.7 |
| Capital Expenditure | -14,461.0 | -20,153.0 | -19,801.0 | -18,358.0 | -10,613.0 | -21,074.3 | -22,884.4 | -24,849.9 | -26,984.2 | -29,301.9 |
| Capital Expenditure, % | -1.52 | -1.96 | -1.73 | -1.51 | -0.82591 | -1.51 | -1.51 | -1.51 | -1.51 | -1.51 |
| Tax Rate, % | 43.08 | 43.08 | 43.08 | 43.08 | 43.08 | 43.08 | 43.08 | 43.08 | 43.08 | 43.08 |
| EBITAT | 28,289.1 | 26,833.5 | 27,679.0 | 26,924.5 | 15,404.4 | 31,573.2 | 34,285.0 | 37,229.7 | 40,427.3 | 43,899.6 |
| Depreciation | ||||||||||
| Changes in Account Receivables | ||||||||||
| Changes in Inventories | ||||||||||
| Changes in Accounts Payable | ||||||||||
| Capital Expenditure | ||||||||||
| UFCF | 33,088.1 | -9,058.5 | 33,599.0 | 22,484.5 | 22,835.4 | 50,941.6 | 37,803.0 | 41,049.9 | 44,575.7 | 48,404.2 |
| WACC, % | 4.41 | 4.39 | 4.38 | 4.4 | 4.37 | 4.39 | 4.39 | 4.39 | 4.39 | 4.39 |
| PV UFCF | ||||||||||
| SUM PV UFCF | 196,156.8 | |||||||||
| Long Term Growth Rate, % | 2.00 | |||||||||
| Free cash flow (T + 1) | 49,372 | |||||||||
| Terminal Value | 2,065,323 | |||||||||
| Present Terminal Value | 1,666,028 | |||||||||
| Enterprise Value | 1,862,185 | |||||||||
| Net Debt | 46,238 | |||||||||
| Equity Value | 1,815,947 | |||||||||
| Diluted Shares Outstanding, MM | 207 | |||||||||
| Equity Value Per Share | 8,762.24 |
What You Will Receive
- Customizable Excel Template: A fully adjustable Excel-based DCF Calculator featuring pre-filled financial data for Welcia Holdings Co., Ltd. (3141T).
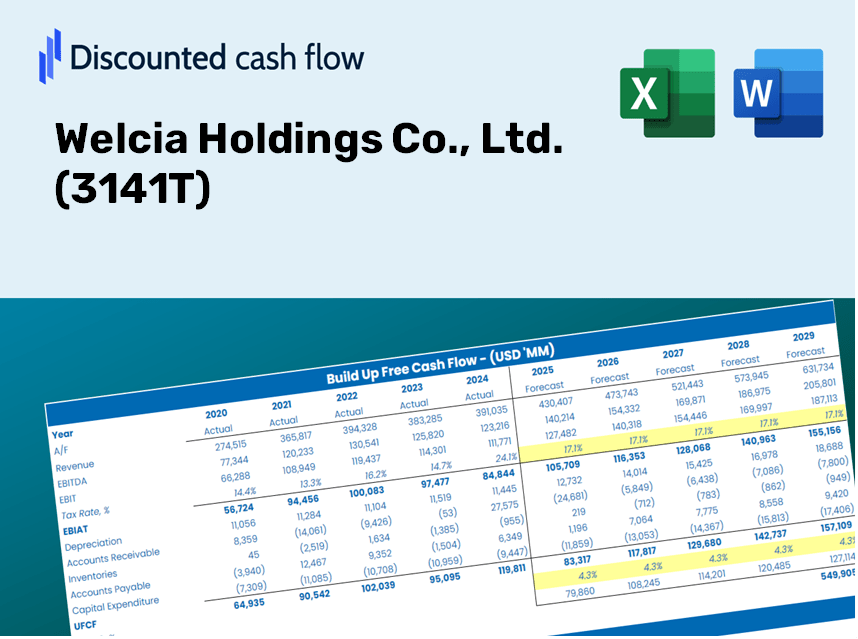
- Authentic Data: Access to historical performance data along with projected estimates (highlighted in the yellow cells).
- Adjustable Forecasting: Modify forecast assumptions such as revenue growth, EBITDA margin, and WACC.
- Instant Calculations: Quickly observe how your inputs influence the valuation of Welcia Holdings Co., Ltd. (3141T).
- Expert-Level Tool: Designed for investors, CFOs, consultants, and financial analysts.
- Intuitive Interface: Organized for simplicity and ease of use, complete with step-by-step guidance.
Key Features
- Customizable Forecast Inputs: Adjust key variables such as sales growth, operating margin, and investment expenditures.
- Instant DCF Valuation: Quickly computes intrinsic value, net present value, and additional financial metrics.
- High-Precision Analysis: Leverages Welcia Holdings' actual financial data for accurate valuation insights.
- Simplified Scenario Testing: Effortlessly evaluate various assumptions and analyze different results.
- Efficiency Booster: Save time by avoiding the complexities of building detailed valuation models from the ground up.
How It Functions
- Download the Template: Gain immediate access to the Excel-based Welcia DCF Calculator for (3141T).
- Input Your Assumptions: Modify the yellow-highlighted cells for growth rates, WACC, margins, and more.
- Instant Calculations: The model automatically recalculates Welcia's intrinsic value.
- Test Scenarios: Experiment with various assumptions to assess potential changes in valuation.
- Analyze and Make Decisions: Utilize the outcomes to inform your investment or financial analysis.
Why Choose This Calculator for Welcia Holdings Co., Ltd. (3141T)?
- Accurate Data: Access genuine Welcia financials for dependable valuation outcomes.
- Customizable: Tailor essential parameters like growth rates, WACC, and tax rates to align with your forecasts.
- Time-Saving: Ready-made calculations save you the hassle of building from the ground up.
- Professional-Grade Tool: Crafted for investors, analysts, and consultants focusing on (3141T).
- User-Friendly: An intuitive design and clear instructions ensure ease of use for everyone.
Who Should Utilize This Product?
- Professional Investors: Develop comprehensive and accurate valuation models for portfolio evaluation.
- Corporate Finance Teams: Assess valuation scenarios to inform strategic decision-making.
- Consultants and Advisors: Deliver precise valuation insights for [Welcia Holdings Co., Ltd. (3141T)] to clients.
- Students and Educators: Leverage real-world data to enhance financial modeling skills and instruction.
- Retail Sector Enthusiasts: Gain insights into how companies like [Welcia Holdings Co., Ltd. (3141T)] are valued in the market.
Overview of the Template Components
- Operating and Balance Sheet Data: Pre-filled historical data and forecasts for Welcia Holdings Co., Ltd. (3141T), covering aspects such as revenue, EBITDA, EBIT, and capital expenditures.
- WACC Calculation: A specific sheet dedicated to the Weighted Average Cost of Capital (WACC), featuring parameters like Beta, risk-free rate, and share price.
- DCF Valuation (Unlevered and Levered): Customizable Discounted Cash Flow models that illustrate intrinsic value with comprehensive calculations.
- Financial Statements: Pre-loaded annual and quarterly financial statements to facilitate analysis.
- Key Ratios: Includes metrics for profitability, leverage, and efficiency relevant to Welcia Holdings Co., Ltd. (3141T).
- Dashboard and Charts: A visual overview of valuation results and assumptions for easier analysis of outcomes.
Disclaimer
All information, articles, and product details provided on this website are for general informational and educational purposes only. We do not claim any ownership over, nor do we intend to infringe upon, any trademarks, copyrights, logos, brand names, or other intellectual property mentioned or depicted on this site. Such intellectual property remains the property of its respective owners, and any references here are made solely for identification or informational purposes, without implying any affiliation, endorsement, or partnership.
We make no representations or warranties, express or implied, regarding the accuracy, completeness, or suitability of any content or products presented. Nothing on this website should be construed as legal, tax, investment, financial, medical, or other professional advice. In addition, no part of this site—including articles or product references—constitutes a solicitation, recommendation, endorsement, advertisement, or offer to buy or sell any securities, franchises, or other financial instruments, particularly in jurisdictions where such activity would be unlawful.
All content is of a general nature and may not address the specific circumstances of any individual or entity. It is not a substitute for professional advice or services. Any actions you take based on the information provided here are strictly at your own risk. You accept full responsibility for any decisions or outcomes arising from your use of this website and agree to release us from any liability in connection with your use of, or reliance upon, the content or products found herein.