
|
Mori Hills REIT Investment Corporation (3234.T) DCF Valuation |
Fully Editable: Tailor To Your Needs In Excel Or Sheets
Professional Design: Trusted, Industry-Standard Templates
Investor-Approved Valuation Models
MAC/PC Compatible, Fully Unlocked
No Expertise Is Needed; Easy To Follow
Mori Hills REIT Investment Corporation (3234.T) Bundle
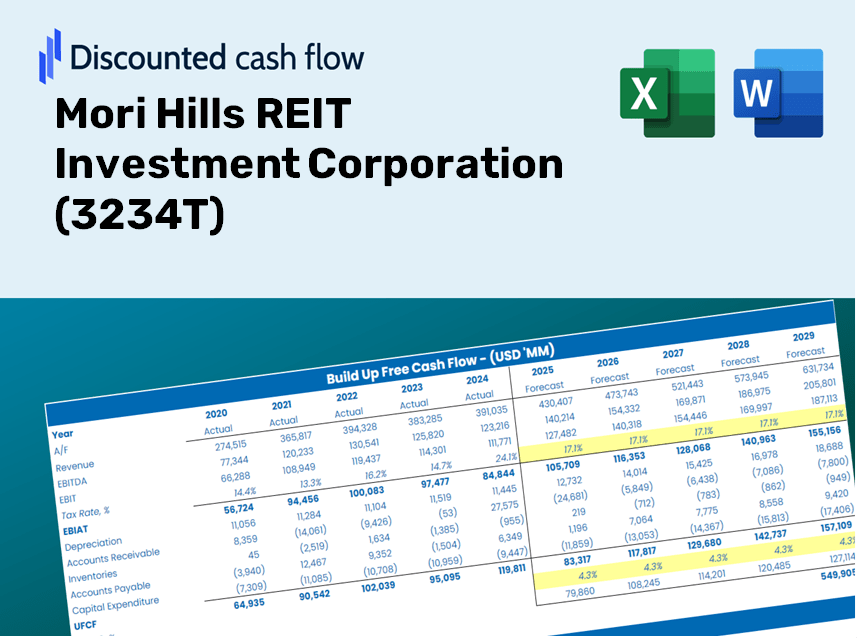
Simplify Mori Hills REIT Investment Corporation (3234T) valuation with this customizable DCF Calculator! Featuring real Mori Hills REIT Investment Corporation (3234T) financials and adjustable forecast inputs, you can test various scenarios and discover Mori Hills REIT Investment Corporation (3234T) fair value in just a few minutes.
Discounted Cash Flow (DCF) - (USD MM)
| Year | AY1 2020 |
AY2 2021 |
AY3 2022 |
AY4 2023 |
AY5 2024 |
FY1 2025 |
FY2 2026 |
FY3 2027 |
FY4 2028 |
FY5 2029 |
|---|---|---|---|---|---|---|---|---|---|---|
| Revenue | 19,661.9 | 21,017.8 | 22,425.9 | 22,350.5 | 11,088.3 | 10,059.0 | 9,125.3 | 8,278.3 | 7,509.9 | 6,812.8 |
| Revenue Growth, % | 0 | 6.9 | 6.7 | -0.33629 | -50.39 | -9.28 | -9.28 | -9.28 | -9.28 | -9.28 |
| EBITDA | 14,138.4 | 14,954.5 | 15,819.8 | 15,842.5 | .0 | 5,723.3 | 5,192.0 | 4,710.1 | 4,272.9 | 3,876.2 |
| EBITDA, % | 71.91 | 71.15 | 70.54 | 70.88 | 0 | 56.9 | 56.9 | 56.9 | 56.9 | 56.9 |
| Depreciation | 2,129.4 | 2,167.5 | 2,185.9 | 2,159.9 | .0 | 815.9 | 740.1 | 671.4 | 609.1 | 552.6 |
| Depreciation, % | 10.83 | 10.31 | 9.75 | 9.66 | 0 | 8.11 | 8.11 | 8.11 | 8.11 | 8.11 |
| EBIT | 12,009.0 | 12,787.0 | 13,633.9 | 13,682.6 | .0 | 4,907.4 | 4,451.9 | 4,038.6 | 3,663.8 | 3,323.7 |
| EBIT, % | 61.08 | 60.84 | 60.8 | 61.22 | 0 | 48.79 | 48.79 | 48.79 | 48.79 | 48.79 |
| Total Cash | 8,310.2 | 10,640.2 | 16,049.3 | 18,221.0 | 19,640.9 | 6,960.5 | 6,314.4 | 5,728.2 | 5,196.5 | 4,714.2 |
| Total Cash, percent | .0 | .0 | .0 | .0 | .0 | .0 | .0 | .0 | .0 | .0 |
| Account Receivables | 186.0 | 169.5 | 224.4 | 470.9 | .0 | 97.8 | 88.7 | 80.5 | 73.0 | 66.2 |
| Account Receivables, % | 0.94605 | 0.80638 | 1 | 2.11 | 0 | 0.97203 | 0.97203 | 0.97203 | 0.97203 | 0.97203 |
| Inventories | 5,217.4 | 21,110.9 | 5,712.1 | .0 | .0 | 3,058.1 | 2,774.2 | 2,516.7 | 2,283.1 | 2,071.2 |
| Inventories, % | 26.54 | 100.44 | 25.47 | 0 | 0 | 30.4 | 30.4 | 30.4 | 30.4 | 30.4 |
| Accounts Payable | 361.5 | 147.4 | 202.3 | 295.1 | .0 | 95.8 | 86.9 | 78.9 | 71.5 | 64.9 |
| Accounts Payable, % | 1.84 | 0.7013 | 0.90222 | 1.32 | 0 | 0.9525 | 0.9525 | 0.9525 | 0.9525 | 0.9525 |
| Capital Expenditure | -13,501.7 | -8,819.3 | -788.7 | -950.3 | .0 | -2,382.0 | -2,160.9 | -1,960.3 | -1,778.3 | -1,613.3 |
| Capital Expenditure, % | -68.67 | -41.96 | -3.52 | -4.25 | 0 | -23.68 | -23.68 | -23.68 | -23.68 | -23.68 |
| Tax Rate, % | 0.01451833 | 0.01451833 | 0.01451833 | 0.01451833 | 0.01451833 | 0.01451833 | 0.01451833 | 0.01451833 | 0.01451833 | 0.01451833 |
| EBITAT | 12,006.6 | 12,785.1 | 13,631.9 | 13,680.3 | .0 | 4,906.6 | 4,451.2 | 4,038.0 | 3,663.2 | 3,323.1 |
| Depreciation | ||||||||||
| Changes in Account Receivables | ||||||||||
| Changes in Inventories | ||||||||||
| Changes in Accounts Payable | ||||||||||
| Capital Expenditure | ||||||||||
| UFCF | -4,407.5 | -9,957.8 | 30,427.8 | 20,448.2 | 175.8 | 280.5 | 3,314.5 | 3,006.8 | 2,727.7 | 2,474.5 |
| WACC, % | 4.18 | 4.18 | 4.18 | 4.18 | 4.18 | 4.18 | 4.18 | 4.18 | 4.18 | 4.18 |
| PV UFCF | ||||||||||
| SUM PV UFCF | 10,313.9 | |||||||||
| Long Term Growth Rate, % | 2.00 | |||||||||
| Free cash flow (T + 1) | 2,524 | |||||||||
| Terminal Value | 115,734 | |||||||||
| Present Terminal Value | 94,302 | |||||||||
| Enterprise Value | 104,616 | |||||||||
| Net Debt | 145,587 | |||||||||
| Equity Value | -40,971 | |||||||||
| Diluted Shares Outstanding, MM | 2 | |||||||||
| Equity Value Per Share | -21,379.81 |
What You Will Receive
- Authentic (3234T) Financial Data: Pre-loaded with Mori Hills REIT Investment Corporation’s historical and projected metrics for accurate analysis.
- Completely Customizable Template: Easily adjust key variables such as revenue growth, WACC, and EBITDA percentages.
- Instant Calculations: Watch the intrinsic value of (3234T) refresh immediately based on your modifications.
- Expert Valuation Tool: Tailored for investors, analysts, and consultants seeking reliable DCF outcomes.
- Intuitive Interface: Streamlined layout and straightforward instructions suitable for all skill levels.
Key Features
- Real-Time Mori Hills Data: Pre-filled with Mori Hills REIT's historical financial performance and projected future metrics.
- Fully Adjustable Parameters: Modify revenue growth rates, operating margins, weighted average cost of capital (WACC), tax rates, and capital expenditures as needed.
- Interactive Valuation Model: Automatically recalculates Net Present Value (NPV) and intrinsic value based on the parameters you set.
- Scenario Analysis: Develop various forecasting scenarios to assess different valuation possibilities.
- User-Centric Interface: Intuitive and organized design suitable for both experienced investors and newcomers.
How It Works
- Download: Obtain the pre-configured Excel file containing Mori Hills REIT Investment Corporation's (3234T) financial data.
- Customize: Modify forecasts such as revenue growth, EBITDA percentage, and WACC to suit your analysis.
- Update Automatically: The calculations for intrinsic value and NPV refresh in real-time as you make adjustments.
- Test Scenarios: Generate various projections and quickly assess different outcomes.
- Make Decisions: Leverage the valuation insights to inform your investment approach.
Why Choose This Calculator for Mori Hills REIT Investment Corporation (3234T)?
- Accurate Data: Current financials for Mori Hills REIT ensure dependable valuation outcomes.
- Customizable: Modify essential parameters such as growth rates, WACC, and tax rates to align with your forecasts.
- Time-Saving: Pre-configured calculations save you from needing to start anew.
- Professional-Grade Tool: Tailored for investors, analysts, and financial consultants.
- User-Friendly: An intuitive interface and clear step-by-step guidance make it accessible for everyone.
Who Should Use This Product?
- Real Estate Students: Discover valuation methods and apply them to real-world scenarios.
- Researchers: Integrate advanced models into academic projects and studies.
- Investors: Validate your hypotheses and assess valuation results for Mori Hills REIT Investment Corporation (3234T).
- Financial Analysts: Enhance your efficiency with a ready-to-use, customizable DCF model.
- Property Managers: Understand the analysis processes applied to large-scale real estate firms like Mori Hills REIT Investment Corporation (3234T).
Contents of the Template
- Historical Data: Contains past financial performance and baseline projections for Mori Hills REIT Investment Corporation (3234T).
- DCF and Levered DCF Models: Comprehensive templates for determining the intrinsic value of Mori Hills REIT (3234T).
- WACC Sheet: Pre-configured calculations for Weighted Average Cost of Capital.
- Editable Inputs: Tailor essential inputs such as growth rates, EBITDA %, and CAPEX assumptions.
- Quarterly and Annual Statements: Detailed analysis of Mori Hills REIT's (3234T) financials.
- Interactive Dashboard: Dynamically visualize valuation outcomes and forecasts.
Disclaimer
All information, articles, and product details provided on this website are for general informational and educational purposes only. We do not claim any ownership over, nor do we intend to infringe upon, any trademarks, copyrights, logos, brand names, or other intellectual property mentioned or depicted on this site. Such intellectual property remains the property of its respective owners, and any references here are made solely for identification or informational purposes, without implying any affiliation, endorsement, or partnership.
We make no representations or warranties, express or implied, regarding the accuracy, completeness, or suitability of any content or products presented. Nothing on this website should be construed as legal, tax, investment, financial, medical, or other professional advice. In addition, no part of this site—including articles or product references—constitutes a solicitation, recommendation, endorsement, advertisement, or offer to buy or sell any securities, franchises, or other financial instruments, particularly in jurisdictions where such activity would be unlawful.
All content is of a general nature and may not address the specific circumstances of any individual or entity. It is not a substitute for professional advice or services. Any actions you take based on the information provided here are strictly at your own risk. You accept full responsibility for any decisions or outcomes arising from your use of this website and agree to release us from any liability in connection with your use of, or reliance upon, the content or products found herein.