
|
NIPPON REIT Investment Corporation (3296.T) DCF Valuation |
Fully Editable: Tailor To Your Needs In Excel Or Sheets
Professional Design: Trusted, Industry-Standard Templates
Investor-Approved Valuation Models
MAC/PC Compatible, Fully Unlocked
No Expertise Is Needed; Easy To Follow
NIPPON REIT Investment Corporation (3296.T) Bundle
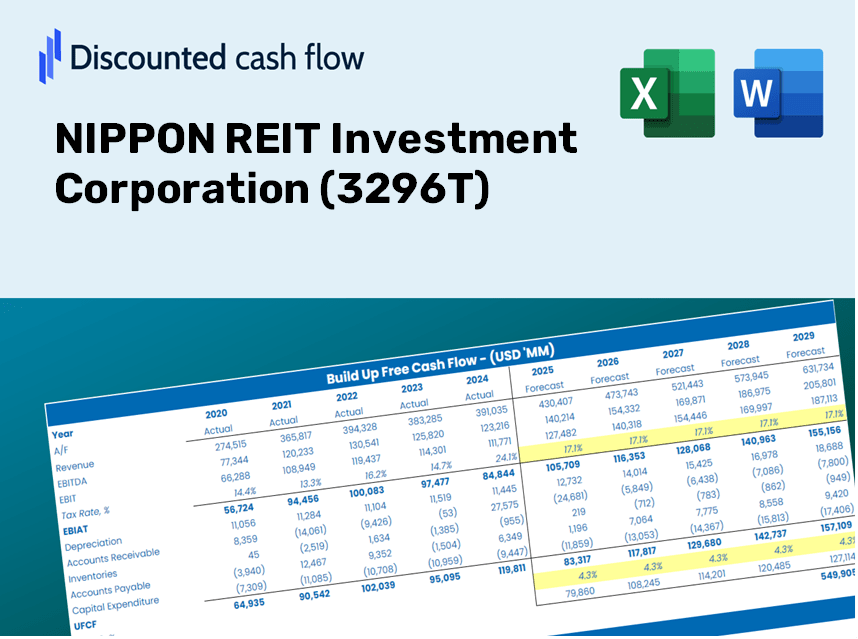
Enhance your investment strategies with the NIPPON REIT Investment Corporation (3296T) DCF Calculator! Review authentic financial data, adjust growth projections and expenses, and witness how these modifications affect the intrinsic value of (3296T) in real-time.
Discounted Cash Flow (DCF) - (USD MM)
| Year | AY1 2021 |
AY2 2022 |
AY3 2023 |
AY4 2024 |
AY5 2025 |
FY1 2026 |
FY2 2027 |
FY3 2028 |
FY4 2029 |
FY5 2030 |
|---|---|---|---|---|---|---|---|---|---|---|
| Revenue | 18,785.8 | 19,452.3 | 20,283.1 | 17,694.2 | 19,829.2 | 20,182.3 | 20,541.6 | 20,907.3 | 21,279.5 | 21,658.3 |
| Revenue Growth, % | 0 | 3.55 | 4.27 | -12.76 | 12.07 | 1.78 | 1.78 | 1.78 | 1.78 | 1.78 |
| EBITDA | 12,307.4 | 12,999.8 | 10,903.6 | 10,628.0 | 12,605.1 | 12,502.2 | 12,724.8 | 12,951.4 | 13,181.9 | 13,416.6 |
| EBITDA, % | 65.51 | 66.83 | 53.76 | 60.07 | 63.57 | 61.95 | 61.95 | 61.95 | 61.95 | 61.95 |
| Depreciation | 2,009.1 | 2,014.0 | 2,011.8 | 2,009.1 | 1,985.8 | 2,112.5 | 2,150.1 | 2,188.4 | 2,227.4 | 2,267.0 |
| Depreciation, % | 10.69 | 10.35 | 9.92 | 11.35 | 10.01 | 10.47 | 10.47 | 10.47 | 10.47 | 10.47 |
| EBIT | 10,298.3 | 10,985.8 | 8,891.8 | 8,618.9 | 10,619.3 | 10,389.7 | 10,574.7 | 10,763.0 | 10,954.6 | 11,149.6 |
| EBIT, % | 54.82 | 56.48 | 43.84 | 48.71 | 53.55 | 51.48 | 51.48 | 51.48 | 51.48 | 51.48 |
| Total Cash | 10,247.7 | 9,800.4 | 20,150.0 | 10,246.6 | 15,291.4 | 13,695.7 | 13,939.5 | 14,187.7 | 14,440.3 | 14,697.4 |
| Total Cash, percent | .0 | .0 | .0 | .0 | .0 | .0 | .0 | .0 | .0 | .0 |
| Account Receivables | 84.2 | 86.8 | 122.0 | 97.0 | 94.9 | 101.8 | 103.7 | 105.5 | 107.4 | 109.3 |
| Account Receivables, % | 0.44845 | 0.44617 | 0.60149 | 0.54833 | 0.47863 | 0.50461 | 0.50461 | 0.50461 | 0.50461 | 0.50461 |
| Inventories | 6,624.8 | 6,736.5 | .0 | .0 | .0 | 2,821.3 | 2,871.5 | 2,922.7 | 2,974.7 | 3,027.7 |
| Inventories, % | 35.26 | 34.63 | 0 | 0 | 0 | 13.98 | 13.98 | 13.98 | 13.98 | 13.98 |
| Accounts Payable | 952.1 | 1,085.6 | 986.0 | 1,184.5 | 1,155.9 | 1,131.6 | 1,151.7 | 1,172.2 | 1,193.1 | 1,214.3 |
| Accounts Payable, % | 5.07 | 5.58 | 4.86 | 6.69 | 5.83 | 5.61 | 5.61 | 5.61 | 5.61 | 5.61 |
| Capital Expenditure | -15,741.4 | -13,805.7 | -970.1 | -7,026.5 | -9,651.8 | -10,007.8 | -10,185.9 | -10,367.3 | -10,551.8 | -10,739.7 |
| Capital Expenditure, % | -83.79 | -70.97 | -4.78 | -39.71 | -48.67 | -49.59 | -49.59 | -49.59 | -49.59 | -49.59 |
| Tax Rate, % | 0.02566172 | 0.02566172 | 0.02566172 | 0.02566172 | 0.02566172 | 0.02566172 | 0.02566172 | 0.02566172 | 0.02566172 | 0.02566172 |
| EBITAT | 10,296.9 | 10,926.2 | 8,889.9 | 8,616.4 | 10,616.6 | 10,376.6 | 10,561.3 | 10,749.4 | 10,940.7 | 11,135.5 |
| Depreciation | ||||||||||
| Changes in Account Receivables | ||||||||||
| Changes in Inventories | ||||||||||
| Changes in Accounts Payable | ||||||||||
| Capital Expenditure | ||||||||||
| UFCF | -9,192.5 | -846.1 | 16,533.3 | 3,822.5 | 2,924.0 | -371.2 | 2,493.6 | 2,538.0 | 2,583.2 | 2,629.2 |
| WACC, % | 4.28 | 4.27 | 4.28 | 4.28 | 4.28 | 4.28 | 4.28 | 4.28 | 4.28 | 4.28 |
| PV UFCF | ||||||||||
| SUM PV UFCF | 8,492.2 | |||||||||
| Long Term Growth Rate, % | 3.00 | |||||||||
| Free cash flow (T + 1) | 2,708 | |||||||||
| Terminal Value | 211,649 | |||||||||
| Present Terminal Value | 171,641 | |||||||||
| Enterprise Value | 180,134 | |||||||||
| Net Debt | 117,329 | |||||||||
| Equity Value | 62,805 | |||||||||
| Diluted Shares Outstanding, MM | 2 | |||||||||
| Equity Value Per Share | 34,900.45 |
What You Will Receive
- Genuine NIPPON REIT Data: Preloaded financial metrics – from income to net asset value – based on validated and anticipated figures.
- Comprehensive Customization: Modify all essential parameters (yellow cells) such as discount rate, growth %, and operational costs.
- Real-Time Valuation Adjustments: Automatic updates to assess the influence of changes on NIPPON REIT's fair market value.
- Flexible Excel Template: Designed for quick modifications, scenario analysis, and in-depth forecasting.
- Efficient and Precise: Eliminate the need to build models from the ground up while ensuring accuracy and adaptability.
Key Features
- Customizable Investment Metrics: Adjust essential parameters such as rental income growth, operating margins, and capital expenses.
- Instant DCF Valuation: Quickly computes intrinsic value, net present value (NPV), and other important financial outputs.
- High Precision Valuation: Leverages NIPPON REIT's actual financial data for more accurate valuation results.
- Effortless Scenario Analysis: Easily test various market assumptions and compare the resulting outcomes.
- Efficiency Booster: Streamline your process by avoiding the complexity of creating valuation models from the ground up.
How It Works
- Download the Template: Get immediate access to the Excel-based NIPPON REIT DCF Calculator.
- Input Your Assumptions: Modify the yellow-highlighted cells for growth rates, WACC, margins, and more.
- Instant Calculations: The model will automatically update the intrinsic value of NIPPON REIT (3296T).
- Test Scenarios: Explore various assumptions to assess potential changes in valuation.
- Analyze and Decide: Leverage the results to inform your investment or financial analysis.
Why Choose This Calculator for NIPPON REIT Investment Corporation (3296T)?
- Precise Financials: Rely on actual NIPPON REIT financial data for trustworthy valuation outcomes.
- Tailored Features: Modify key inputs such as growth projections, WACC, and tax rates to align with your analysis.
- Efficiency Boost: Ready-to-use calculations save you the hassle of building from the ground up.
- Professional-Quality Tool: Crafted for investors, analysts, and financial consultants.
- Easy to Navigate: User-friendly design and clear guidance ensure accessibility for everyone.
Who Should Utilize This Product?
- Investors: Accurately assess the fair value of Nippon REIT Investment Corporation (3296T) prior to making investment choices.
- CFOs: Employ a professional-grade DCF model for comprehensive financial reporting and analysis.
- Consultants: Efficiently tailor the template for valuation reports for clients focused on Nippon REIT (3296T).
- Entrepreneurs: Acquire insights into financial modeling practices utilized by leading real estate investment trusts.
- Educators: Implement it as a teaching resource to illustrate various valuation methodologies.
Contents of the Template
- Pre-Filled DCF Model: Financial data for NIPPON REIT Investment Corporation (3296T) preloaded for immediate application.
- WACC Calculator: Comprehensive calculations for the Weighted Average Cost of Capital.
- Financial Ratios: Assess NIPPON REIT's profitability, leverage, and operational efficiency.
- Editable Inputs: Modify key assumptions such as growth rates, profit margins, and capital expenditures to align with your analysis.
- Financial Statements: Access annual and quarterly reports to facilitate in-depth examination.
- Interactive Dashboard: Effortlessly visualize essential valuation metrics and outcomes.
Disclaimer
All information, articles, and product details provided on this website are for general informational and educational purposes only. We do not claim any ownership over, nor do we intend to infringe upon, any trademarks, copyrights, logos, brand names, or other intellectual property mentioned or depicted on this site. Such intellectual property remains the property of its respective owners, and any references here are made solely for identification or informational purposes, without implying any affiliation, endorsement, or partnership.
We make no representations or warranties, express or implied, regarding the accuracy, completeness, or suitability of any content or products presented. Nothing on this website should be construed as legal, tax, investment, financial, medical, or other professional advice. In addition, no part of this site—including articles or product references—constitutes a solicitation, recommendation, endorsement, advertisement, or offer to buy or sell any securities, franchises, or other financial instruments, particularly in jurisdictions where such activity would be unlawful.
All content is of a general nature and may not address the specific circumstances of any individual or entity. It is not a substitute for professional advice or services. Any actions you take based on the information provided here are strictly at your own risk. You accept full responsibility for any decisions or outcomes arising from your use of this website and agree to release us from any liability in connection with your use of, or reliance upon, the content or products found herein.