
|
China Resources Pharmaceutical Group Limited (3320.HK) DCF Valuation |
Fully Editable: Tailor To Your Needs In Excel Or Sheets
Professional Design: Trusted, Industry-Standard Templates
Investor-Approved Valuation Models
MAC/PC Compatible, Fully Unlocked
No Expertise Is Needed; Easy To Follow
China Resources Pharmaceutical Group Limited (3320.HK) Bundle
Simplify China Resources Pharmaceutical Group Limited (3320HK) valuation with this customizable DCF Calculator! Featuring real China Resources Pharmaceutical Group Limited (3320HK) financials and adjustable forecast inputs, you can test scenarios and uncover China Resources Pharmaceutical Group Limited (3320HK) fair value in minutes.
Discounted Cash Flow (DCF) - (USD MM)
| Year | AY1 2020 |
AY2 2021 |
AY3 2022 |
AY4 2023 |
AY5 2024 |
FY1 2025 |
FY2 2026 |
FY3 2027 |
FY4 2028 |
FY5 2029 |
|---|---|---|---|---|---|---|---|---|---|---|
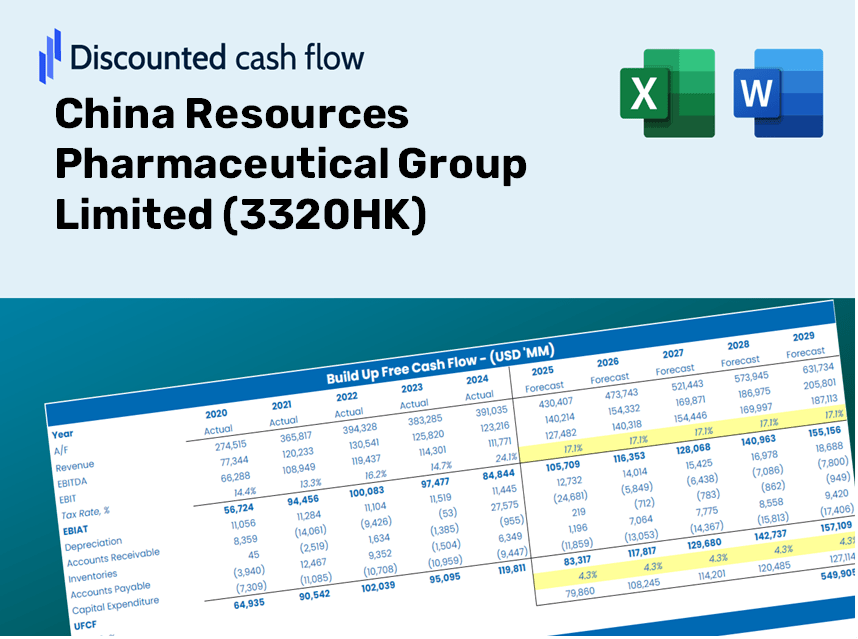
| Revenue | 200,423.0 | 236,806.2 | 254,106.4 | 270,397.3 | 274,182.5 | 285,321.1 | 296,912.3 | 308,974.3 | 321,526.3 | 334,588.3 |
| Revenue Growth, % | 0 | 18.15 | 7.31 | 6.41 | 1.4 | 4.06 | 4.06 | 4.06 | 4.06 | 4.06 |
| EBITDA | 12,466.0 | 11,945.8 | 15,473.2 | 15,430.9 | 15,452.7 | 16,375.3 | 17,040.6 | 17,732.8 | 18,453.2 | 19,202.9 |
| EBITDA, % | 6.22 | 5.04 | 6.09 | 5.71 | 5.64 | 5.74 | 5.74 | 5.74 | 5.74 | 5.74 |
| Depreciation | 2,444.1 | 2,821.9 | 3,152.2 | 3,164.4 | 2,701.2 | 3,313.7 | 3,448.4 | 3,588.4 | 3,734.2 | 3,885.9 |
| Depreciation, % | 1.22 | 1.19 | 1.24 | 1.17 | 0.98518 | 1.16 | 1.16 | 1.16 | 1.16 | 1.16 |
| EBIT | 10,021.9 | 9,123.9 | 12,321.1 | 12,266.5 | 12,751.5 | 13,061.6 | 13,592.2 | 14,144.4 | 14,719.0 | 15,317.0 |
| EBIT, % | 5 | 3.85 | 4.85 | 4.54 | 4.65 | 4.58 | 4.58 | 4.58 | 4.58 | 4.58 |
| Total Cash | 52,337.3 | 37,315.7 | 32,522.3 | 59,266.4 | 17,477.1 | 47,341.9 | 49,265.2 | 51,266.6 | 53,349.3 | 55,516.6 |
| Total Cash, percent | .0 | .0 | .0 | .0 | .0 | .0 | .0 | .0 | .0 | .0 |
| Account Receivables | 66,449.6 | 66,380.4 | 102,615.2 | 82,586.5 | 108,183.8 | 97,904.2 | 101,881.6 | 106,020.5 | 110,327.6 | 114,809.6 |
| Account Receivables, % | 33.15 | 28.03 | 40.38 | 30.54 | 39.46 | 34.31 | 34.31 | 34.31 | 34.31 | 34.31 |
| Inventories | 24,584.8 | 29,688.0 | 29,718.4 | 31,875.5 | 39,426.6 | 35,760.2 | 37,213.0 | 38,724.7 | 40,297.9 | 41,935.0 |
| Inventories, % | 12.27 | 12.54 | 11.7 | 11.79 | 14.38 | 12.53 | 12.53 | 12.53 | 12.53 | 12.53 |
| Accounts Payable | 38,511.3 | 61,764.3 | 48,711.2 | 54,451.0 | 42,634.9 | 57,152.2 | 59,474.0 | 61,890.1 | 64,404.4 | 67,020.8 |
| Accounts Payable, % | 19.22 | 26.08 | 19.17 | 20.14 | 15.55 | 20.03 | 20.03 | 20.03 | 20.03 | 20.03 |
| Capital Expenditure | -2,218.5 | -2,902.9 | -3,356.3 | -3,132.7 | -3,000.6 | -3,370.5 | -3,507.4 | -3,649.9 | -3,798.2 | -3,952.5 |
| Capital Expenditure, % | -1.11 | -1.23 | -1.32 | -1.16 | -1.09 | -1.18 | -1.18 | -1.18 | -1.18 | -1.18 |
| Tax Rate, % | 69.34 | 69.34 | 69.34 | 69.34 | 69.34 | 69.34 | 69.34 | 69.34 | 69.34 | 69.34 |
| EBITAT | 3,935.8 | 3,342.8 | 4,375.8 | 4,349.6 | 3,909.3 | 4,637.9 | 4,826.4 | 5,022.4 | 5,226.5 | 5,438.8 |
| Depreciation | ||||||||||
| Changes in Account Receivables | ||||||||||
| Changes in Inventories | ||||||||||
| Changes in Accounts Payable | ||||||||||
| Capital Expenditure | ||||||||||
| UFCF | -48,361.8 | 21,480.8 | -45,146.7 | 27,992.7 | -41,354.6 | 33,044.3 | 1,659.0 | 1,726.4 | 1,796.5 | 1,869.5 |
| WACC, % | 2.41 | 2.34 | 2.31 | 2.31 | 2.19 | 2.31 | 2.31 | 2.31 | 2.31 | 2.31 |
| PV UFCF | ||||||||||
| SUM PV UFCF | 38,800.2 | |||||||||
| Long Term Growth Rate, % | 0.50 | |||||||||
| Free cash flow (T + 1) | 1,879 | |||||||||
| Terminal Value | 103,556 | |||||||||
| Present Terminal Value | 92,362 | |||||||||
| Enterprise Value | 131,163 | |||||||||
| Net Debt | 55,949 | |||||||||
| Equity Value | 75,213 | |||||||||
| Diluted Shares Outstanding, MM | 6,283 | |||||||||
| Equity Value Per Share | 11.97 |
What You Will Receive
- Customizable Excel Template: A fully adaptable Excel-based DCF Calculator featuring pre-loaded financial data for China Resources Pharmaceutical Group Limited (3320HK).
- Accurate Market Data: Access to historical figures and future projections (displayed in the highlighted cells).
- Adjustable Forecasts: Modify key forecast parameters such as revenue growth, EBITDA margin, and WACC.
- Instant Calculations: Quickly observe how your inputs influence the valuation of China Resources Pharmaceutical Group Limited (3320HK).
- Professional Resource: Designed for use by investors, CFOs, consultants, and financial analysts.
- Intuitive Interface: Organized for ease of understanding and navigation, complete with step-by-step guidance.
Key Features
- Advanced DCF Calculator: Features comprehensive unlevered and levered DCF valuation models tailored for China Resources Pharmaceutical Group Limited (3320HK).
- WACC Calculator: Comes with a pre-built Weighted Average Cost of Capital sheet, allowing for customizable inputs specific to (3320HK).
- Editable Forecast Assumptions: Adjust growth rates, capital expenditures, and discount rates to fit the unique profile of (3320HK).
- Built-In Financial Ratios: Evaluate profitability, leverage, and efficiency ratios specifically for China Resources Pharmaceutical Group Limited (3320HK).
- Dashboard and Charts: Visual displays that summarize essential valuation metrics for straightforward analysis of (3320HK).
How It Operates
- Download: Get the pre-prepared Excel file featuring China Resources Pharmaceutical Group Limited’s (3320HK) financial data.
- Customize: Modify forecasts including revenue growth, EBITDA %, and WACC as per your analysis.
- Update Automatically: Enjoy real-time updates on intrinsic value and NPV calculations.
- Test Scenarios: Develop various projections and instantly compare the results.
- Make Decisions: Leverage the valuation outcomes to shape your investment strategy.
Why Opt for This Calculator?
- Time-Saving: Skip the hassle of building a DCF model from scratch – it's pre-configured and ready for use.
- Enhanced Accuracy: Dependable financial data and formulas minimize valuation errors.
- Completely Customizable: Adjust the model to align with your unique assumptions and forecasts.
- User-Friendly: Intuitive charts and outputs simplify the analysis of results.
- Endorsed by Professionals: Tailored for experts who prioritize precision and ease of use.
Who Can Benefit from This Product?
- Finance Students: Master valuation techniques and apply them to real-world data.
- Academics: Integrate professional models into your courses or research projects.
- Investors: Validate your assumptions and evaluate valuation outcomes for China Resources Pharmaceutical Group Limited (3320HK) stock.
- Analysts: Enhance your productivity with an easy-to-use, customizable DCF model.
- Small Business Owners: Discover how large public companies like China Resources Pharmaceutical Group Limited (3320HK) are assessed in the market.
Contents of the Template
- Comprehensive DCF Model: Editable template featuring in-depth valuation calculations.
- Real-World Data: Preloaded historical and projected financials for China Resources Pharmaceutical Group Limited (3320HK) for your analysis.
- Customizable Parameters: Modify WACC, growth rates, and tax assumptions to explore various scenarios.
- Financial Statements: Complete annual and quarterly breakdowns to provide deeper insights.
- Key Ratios: Integrated analysis for assessing profitability, efficiency, and leverage.
- Dashboard with Visual Outputs: Charts and tables designed for clear, actionable insights.
Disclaimer
All information, articles, and product details provided on this website are for general informational and educational purposes only. We do not claim any ownership over, nor do we intend to infringe upon, any trademarks, copyrights, logos, brand names, or other intellectual property mentioned or depicted on this site. Such intellectual property remains the property of its respective owners, and any references here are made solely for identification or informational purposes, without implying any affiliation, endorsement, or partnership.
We make no representations or warranties, express or implied, regarding the accuracy, completeness, or suitability of any content or products presented. Nothing on this website should be construed as legal, tax, investment, financial, medical, or other professional advice. In addition, no part of this site—including articles or product references—constitutes a solicitation, recommendation, endorsement, advertisement, or offer to buy or sell any securities, franchises, or other financial instruments, particularly in jurisdictions where such activity would be unlawful.
All content is of a general nature and may not address the specific circumstances of any individual or entity. It is not a substitute for professional advice or services. Any actions you take based on the information provided here are strictly at your own risk. You accept full responsibility for any decisions or outcomes arising from your use of this website and agree to release us from any liability in connection with your use of, or reliance upon, the content or products found herein.