
|
Lonking Holdings Limited (3339.HK) DCF Valuation |
Fully Editable: Tailor To Your Needs In Excel Or Sheets
Professional Design: Trusted, Industry-Standard Templates
Investor-Approved Valuation Models
MAC/PC Compatible, Fully Unlocked
No Expertise Is Needed; Easy To Follow
Lonking Holdings Limited (3339.HK) Bundle
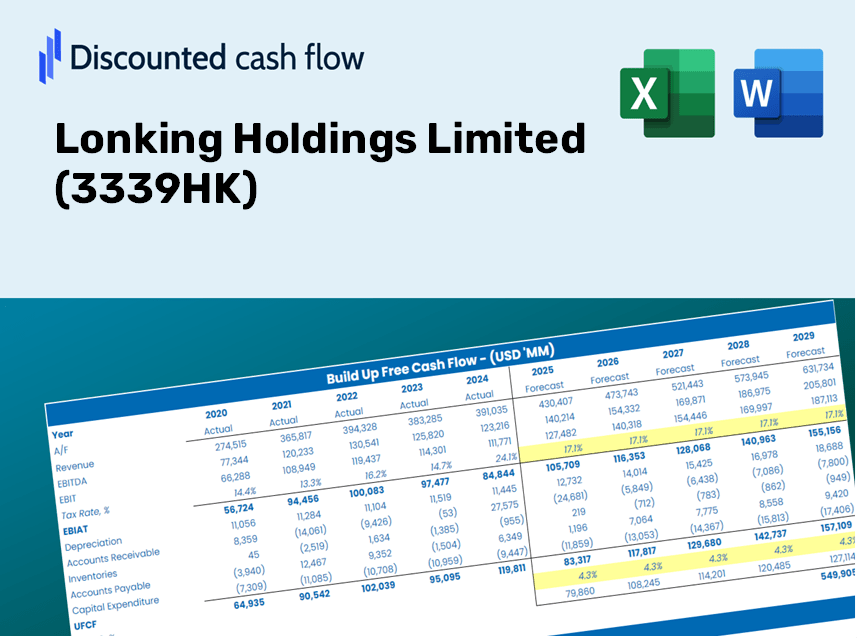
Gain insight into your Lonking Holdings Limited (3339HK) valuation analysis using our state-of-the-art DCF Calculator! Equipped with real (3339HK) data, this Excel template enables you to adjust forecasts and assumptions to determine the intrinsic value of Lonking Holdings Limited with accuracy.
Discounted Cash Flow (DCF) - (USD MM)
| Year | AY1 2020 |
AY2 2021 |
AY3 2022 |
AY4 2023 |
AY5 2024 |
FY1 2025 |
FY2 2026 |
FY3 2027 |
FY4 2028 |
FY5 2029 |
|---|---|---|---|---|---|---|---|---|---|---|
| Revenue | 14,080.1 | 14,965.6 | 12,188.7 | 11,503.0 | 11,164.8 | 10,583.3 | 10,032.2 | 9,509.7 | 9,014.4 | 8,545.0 |
| Revenue Growth, % | 0 | 6.29 | -18.56 | -5.63 | -2.94 | -5.21 | -5.21 | -5.21 | -5.21 | -5.21 |
| EBITDA | 2,030.2 | 1,285.7 | 904.9 | 1,041.4 | 1,280.4 | 1,078.6 | 1,022.4 | 969.2 | 918.7 | 870.8 |
| EBITDA, % | 14.42 | 8.59 | 7.42 | 9.05 | 11.47 | 10.19 | 10.19 | 10.19 | 10.19 | 10.19 |
| Depreciation | 366.0 | 312.4 | 295.8 | 294.3 | 294.3 | 260.5 | 246.9 | 234.1 | 221.9 | 210.3 |
| Depreciation, % | 2.6 | 2.09 | 2.43 | 2.56 | 2.64 | 2.46 | 2.46 | 2.46 | 2.46 | 2.46 |
| EBIT | 1,664.3 | 973.3 | 609.1 | 747.1 | 986.1 | 818.1 | 775.4 | 735.1 | 696.8 | 660.5 |
| EBIT, % | 11.82 | 6.5 | 5 | 6.49 | 8.83 | 7.73 | 7.73 | 7.73 | 7.73 | 7.73 |
| Total Cash | 4,955.4 | 4,454.6 | 4,054.9 | 6,284.8 | 6,536.3 | 4,474.8 | 4,241.7 | 4,020.8 | 3,811.4 | 3,612.9 |
| Total Cash, percent | .0 | .0 | .0 | .0 | .0 | .0 | .0 | .0 | .0 | .0 |
| Account Receivables | 3,488.4 | 3,559.3 | 2,682.1 | 3,193.2 | 3,558.6 | 2,755.8 | 2,612.3 | 2,476.3 | 2,347.3 | 2,225.0 |
| Account Receivables, % | 24.78 | 23.78 | 22 | 27.76 | 31.87 | 26.04 | 26.04 | 26.04 | 26.04 | 26.04 |
| Inventories | 4,103.5 | 4,439.3 | 3,925.7 | 3,144.4 | 2,500.3 | 2,979.1 | 2,824.0 | 2,676.9 | 2,537.5 | 2,405.3 |
| Inventories, % | 29.14 | 29.66 | 32.21 | 27.34 | 22.39 | 28.15 | 28.15 | 28.15 | 28.15 | 28.15 |
| Accounts Payable | 5,356.5 | 4,702.3 | 4,146.8 | 4,229.6 | 4,093.7 | 3,744.8 | 3,549.8 | 3,364.9 | 3,189.7 | 3,023.6 |
| Accounts Payable, % | 38.04 | 31.42 | 34.02 | 36.77 | 36.67 | 35.38 | 35.38 | 35.38 | 35.38 | 35.38 |
| Capital Expenditure | -316.5 | -418.0 | -261.6 | -204.0 | -91.2 | -207.0 | -196.2 | -186.0 | -176.3 | -167.1 |
| Capital Expenditure, % | -2.25 | -2.79 | -2.15 | -1.77 | -0.8171 | -1.96 | -1.96 | -1.96 | -1.96 | -1.96 |
| Tax Rate, % | 16.33 | 16.33 | 16.33 | 16.33 | 16.33 | 16.33 | 16.33 | 16.33 | 16.33 | 16.33 |
| EBITAT | 1,413.0 | 854.4 | 555.7 | 624.1 | 825.1 | 705.4 | 668.6 | 633.8 | 600.8 | 569.5 |
| Depreciation | ||||||||||
| Changes in Account Receivables | ||||||||||
| Changes in Inventories | ||||||||||
| Changes in Accounts Payable | ||||||||||
| Capital Expenditure | ||||||||||
| UFCF | -773.0 | -312.1 | 1,425.2 | 1,067.4 | 1,170.9 | 734.0 | 823.0 | 780.2 | 739.5 | 701.0 |
| WACC, % | 8.1 | 8.11 | 8.11 | 8.1 | 8.1 | 8.11 | 8.11 | 8.11 | 8.11 | 8.11 |
| PV UFCF | ||||||||||
| SUM PV UFCF | 3,017.1 | |||||||||
| Long Term Growth Rate, % | 0.50 | |||||||||
| Free cash flow (T + 1) | 705 | |||||||||
| Terminal Value | 9,264 | |||||||||
| Present Terminal Value | 6,274 | |||||||||
| Enterprise Value | 9,291 | |||||||||
| Net Debt | -1,325 | |||||||||
| Equity Value | 10,617 | |||||||||
| Diluted Shares Outstanding, MM | 4,280 | |||||||||
| Equity Value Per Share | 2.48 |
What You Will Receive
- Adjustable Forecast Inputs: Effortlessly modify key assumptions (growth %, margins, WACC) to explore various scenarios.
- Realistic Financial Data: Lonking Holdings Limited’s (3339HK) financials pre-loaded to accelerate your evaluation.
- Instant DCF Calculations: The template automatically computes Net Present Value (NPV) and intrinsic value for you.
- Customizable and Professional Design: A sleek Excel model tailored to meet your valuation requirements.
- Created for Analysts and Investors: Perfect for testing forecasts, confirming strategies, and enhancing efficiency.
Key Features
- Genuine Financial Data: Gain access to precise pre-loaded historical figures and future forecasts for Lonking Holdings Limited (3339HK).
- Adjustable Forecast Parameters: Modify the yellow-highlighted fields such as WACC, growth rates, and profit margins.
- Real-Time Calculations: Automatic updates for DCF, Net Present Value (NPV), and cash flow analysis.
- Interactive Dashboard: User-friendly charts and summaries to help you visualize your valuation outcomes.
- Designed for All Skill Levels: An intuitive layout tailored for investors, CFOs, and consultants alike.
How It Functions
- Download: Obtain the pre-configured Excel file containing financial data for Lonking Holdings Limited (3339HK).
- Customize: Modify projections such as revenue growth, EBITDA %, and WACC to suit your analysis.
- Update Automatically: The intrinsic value and NPV calculations refresh in real-time as you make changes.
- Test Scenarios: Develop multiple forecasts and contrast the results instantly.
- Make Decisions: Leverage the valuation insights to inform your investment strategy.
Why Choose This Calculator for Lonking Holdings Limited (3339HK)?
- Accuracy: Reliable financial data ensures precise calculations.
- Flexibility: Tailored for users to easily adjust and experiment with inputs.
- Time-Saving: Eliminate the complexity of creating a DCF model from the ground up.
- Professional-Grade: Crafted with the expertise and attention to detail expected at the CFO level.
- User-Friendly: Simple to navigate, suitable for users without extensive financial modeling knowledge.
Who Can Benefit from Lonking Holdings Limited (3339HK)?
- Investors: Gain confidence in your investment choices with our professional-grade valuation tool.
- Financial Analysts: Streamline your workflow with a ready-to-customize DCF model.
- Consultants: Easily tailor the template for impactful client presentations or reports.
- Finance Enthusiasts: Enhance your understanding of valuation methods through real-world applications.
- Educators and Students: Utilize this resource as a practical tool in finance courses.
Contents of the Template
- Preloaded 3339HK Data: Historical and projected financial information, including revenue, EBIT, and capital expenditures.
- DCF and WACC Models: Professional-quality sheets designed for calculating intrinsic value and Weighted Average Cost of Capital.
- Editable Inputs: Yellow-highlighted cells for customizing revenue growth, tax rates, and discount rates.
- Financial Statements: Detailed annual and quarterly financials for in-depth analysis.
- Key Ratios: Profitability, leverage, and efficiency ratios to assess performance.
- Dashboard and Charts: Visual summaries of valuation outcomes and underlying assumptions.
Disclaimer
All information, articles, and product details provided on this website are for general informational and educational purposes only. We do not claim any ownership over, nor do we intend to infringe upon, any trademarks, copyrights, logos, brand names, or other intellectual property mentioned or depicted on this site. Such intellectual property remains the property of its respective owners, and any references here are made solely for identification or informational purposes, without implying any affiliation, endorsement, or partnership.
We make no representations or warranties, express or implied, regarding the accuracy, completeness, or suitability of any content or products presented. Nothing on this website should be construed as legal, tax, investment, financial, medical, or other professional advice. In addition, no part of this site—including articles or product references—constitutes a solicitation, recommendation, endorsement, advertisement, or offer to buy or sell any securities, franchises, or other financial instruments, particularly in jurisdictions where such activity would be unlawful.
All content is of a general nature and may not address the specific circumstances of any individual or entity. It is not a substitute for professional advice or services. Any actions you take based on the information provided here are strictly at your own risk. You accept full responsibility for any decisions or outcomes arising from your use of this website and agree to release us from any liability in connection with your use of, or reliance upon, the content or products found herein.