
|
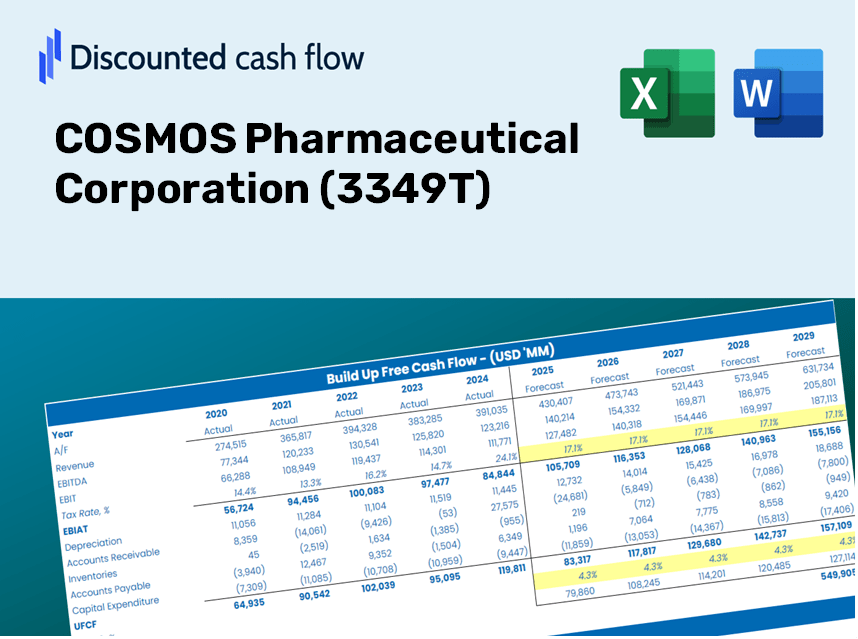
COSMOS Pharmaceutical Corporation (3349.T) DCF Valuation |
Fully Editable: Tailor To Your Needs In Excel Or Sheets
Professional Design: Trusted, Industry-Standard Templates
Investor-Approved Valuation Models
MAC/PC Compatible, Fully Unlocked
No Expertise Is Needed; Easy To Follow
COSMOS Pharmaceutical Corporation (3349.T) Bundle
Whether you’re an investor or an analyst, this [Symbol] DCF Calculator is your go-to resource for accurate valuation. Equipped with real data from COSMOS Pharmaceutical Corporation, you can adjust forecasts and immediately observe the effects.
Discounted Cash Flow (DCF) - (USD MM)
| Year | AY1 2021 |
AY2 2022 |
AY3 2023 |
AY4 2024 |
AY5 2025 |
FY1 2026 |
FY2 2027 |
FY3 2028 |
FY4 2029 |
FY5 2030 |
|---|---|---|---|---|---|---|---|---|---|---|
| Revenue | 726,424.0 | 755,414.0 | 827,697.0 | 964,989.0 | 1,011,390.0 | 1,099,773.1 | 1,195,879.9 | 1,300,385.2 | 1,414,023.0 | 1,537,591.4 |
| Revenue Growth, % | 0 | 3.99 | 9.57 | 16.59 | 4.81 | 8.74 | 8.74 | 8.74 | 8.74 | 8.74 |
| EBITDA | 46,932.0 | 48,210.0 | 50,192.0 | 53,744.0 | 64,855.0 | 67,940.7 | 73,877.9 | 80,334.0 | 87,354.2 | 94,987.9 |
| EBITDA, % | 6.46 | 6.38 | 6.06 | 5.57 | 6.41 | 6.18 | 6.18 | 6.18 | 6.18 | 6.18 |
| Depreciation | 13,785.0 | 15,110.0 | 17,368.0 | 19,924.0 | 22,229.0 | 22,564.7 | 24,536.6 | 26,680.7 | 29,012.3 | 31,547.6 |
| Depreciation, % | 1.9 | 2 | 2.1 | 2.06 | 2.2 | 2.05 | 2.05 | 2.05 | 2.05 | 2.05 |
| EBIT | 33,147.0 | 33,100.0 | 32,824.0 | 33,820.0 | 42,626.0 | 45,376.1 | 49,341.4 | 53,653.2 | 58,341.9 | 63,440.2 |
| EBIT, % | 4.56 | 4.38 | 3.97 | 3.5 | 4.21 | 4.13 | 4.13 | 4.13 | 4.13 | 4.13 |
| Total Cash | 55,108.0 | 37,362.0 | 45,928.0 | 52,301.0 | 57,038.0 | 64,095.7 | 69,696.9 | 75,787.5 | 82,410.4 | 89,612.1 |
| Total Cash, percent | .0 | .0 | .0 | .0 | .0 | .0 | .0 | .0 | .0 | .0 |
| Account Receivables | 6,619.0 | 8,577.0 | 10,221.0 | 12,199.0 | 12,240.0 | 12,660.2 | 13,766.6 | 14,969.6 | 16,277.7 | 17,700.2 |
| Account Receivables, % | 0.91118 | 1.14 | 1.23 | 1.26 | 1.21 | 1.15 | 1.15 | 1.15 | 1.15 | 1.15 |
| Inventories | 60,549.0 | 66,363.0 | 77,479.0 | 86,173.0 | 92,323.0 | 97,966.2 | 106,527.2 | 115,836.4 | 125,959.1 | 136,966.4 |
| Inventories, % | 8.34 | 8.78 | 9.36 | 8.93 | 9.13 | 8.91 | 8.91 | 8.91 | 8.91 | 8.91 |
| Accounts Payable | 133,041.0 | 139,224.0 | 161,852.0 | 179,549.0 | 177,125.0 | 203,278.8 | 221,042.9 | 240,359.4 | 261,363.8 | 284,203.8 |
| Accounts Payable, % | 18.31 | 18.43 | 19.55 | 18.61 | 17.51 | 18.48 | 18.48 | 18.48 | 18.48 | 18.48 |
| Capital Expenditure | -43,497.0 | -46,636.0 | -55,810.0 | -53,326.0 | -53,326.0 | -65,332.7 | -71,042.0 | -77,250.2 | -84,000.9 | -91,341.6 |
| Capital Expenditure, % | -5.99 | -6.17 | -6.74 | -5.53 | -5.27 | -5.94 | -5.94 | -5.94 | -5.94 | -5.94 |
| Tax Rate, % | 26.89 | 26.89 | 26.89 | 26.89 | 26.89 | 26.89 | 26.89 | 26.89 | 26.89 | 26.89 |
| EBITAT | 23,322.1 | 23,191.4 | 23,834.0 | 24,527.2 | 31,163.7 | 32,549.9 | 35,394.4 | 38,487.4 | 41,850.8 | 45,508.0 |
| Depreciation | ||||||||||
| Changes in Account Receivables | ||||||||||
| Changes in Inventories | ||||||||||
| Changes in Accounts Payable | ||||||||||
| Capital Expenditure | ||||||||||
| UFCF | 59,483.1 | -9,923.6 | -4,740.0 | -1,849.8 | -8,548.3 | 9,872.3 | -3,014.4 | -3,277.8 | -3,564.2 | -3,875.7 |
| WACC, % | 4.48 | 4.48 | 4.48 | 4.48 | 4.49 | 4.48 | 4.48 | 4.48 | 4.48 | 4.48 |
| PV UFCF | ||||||||||
| SUM PV UFCF | -2,289.7 | |||||||||
| Long Term Growth Rate, % | 2.00 | |||||||||
| Free cash flow (T + 1) | -3,953 | |||||||||
| Terminal Value | -159,241 | |||||||||
| Present Terminal Value | -127,890 | |||||||||
| Enterprise Value | -130,180 | |||||||||
| Net Debt | -7,081 | |||||||||
| Equity Value | -123,099 | |||||||||
| Diluted Shares Outstanding, MM | 79 | |||||||||
| Equity Value Per Share | -1,553.16 |
What You Will Receive
- Actual COSMOS Financials: Features both historical and projected data for precise valuation.
- Customizable Inputs: Adjust WACC, tax rates, revenue growth, and capital expenses as needed.
- Automatic Calculations: Intrinsic value and NPV are computed in real-time.
- Scenario Analysis: Explore various scenarios to assess COSMOS's future performance.
- Clear and User-Friendly Design: Designed for industry professionals but easy for newcomers to navigate.
Key Features
- 🔍 Real-Life COSMOS Financials: Pre-filled historical and projected data for COSMOS Pharmaceutical Corporation (3349T).
- ✏️ Fully Customizable Inputs: Adjust all essential parameters (yellow cells) such as WACC, growth %, and tax rates.
- 📊 Professional DCF Valuation: Integrated formulas assess COSMOS's intrinsic value using the Discounted Cash Flow method.
- ⚡ Instant Results: Visualize COSMOS’s valuation immediately after making adjustments.
- Scenario Analysis: Evaluate and compare outcomes for different financial assumptions side-by-side.
How It Works
- 1. Access the Template: Download and open the Excel file featuring COSMOS Pharmaceutical Corporation's (3349T) preloaded data.
- 2. Modify Assumptions: Adjust key variables such as growth rates, WACC, and capital expenditures as needed.
- 3. Analyze Results Instantly: The DCF model automatically computes the intrinsic value and NPV for you.
- 4. Explore Various Scenarios: Evaluate multiple forecasts to investigate different valuation outcomes.
- 5. Present with Assurance: Deliver professional valuation insights to strengthen your decision-making process.
Why Choose COSMOS Pharmaceutical Corporation (3349T) Calculator?
- Efficient Solution: Skip the hassle of building a DCF model from the ground up – it's ready for immediate use.
- Enhanced Precision: Dependable financial data and formulas minimize valuation errors.
- Completely Customizable: Adjust the model to mirror your specific assumptions and projections.
- User-Friendly Interface: Intuitive charts and outputs simplify analysis of results.
- Endorsed by Professionals: Crafted for experts who prioritize accuracy and ease of use.
Who Can Benefit from This Product?
- Investors: Accurately assess COSMOS Pharmaceutical Corporation's (3349T) fair value prior to making investment choices.
- CFOs: Utilize a professional-grade DCF model for comprehensive financial reporting and analysis for COSMOS Pharmaceutical Corporation (3349T).
- Consultants: Efficiently customize the template for valuation reports tailored to clients focused on COSMOS Pharmaceutical Corporation (3349T).
- Entrepreneurs: Gain valuable insights into the financial modeling practices of established firms like COSMOS Pharmaceutical Corporation (3349T).
- Educators: Employ this resource as a teaching aid to illustrate various valuation methodologies using COSMOS Pharmaceutical Corporation (3349T) as a case study.
Overview of the Template Features
- Detailed DCF Model: An editable template featuring extensive valuation calculations.
- Real-World Data: COSMOS Pharmaceutical Corporation’s (3349T) historical and projected financials included for analysis.
- Adjustable Parameters: Modify WACC, growth rates, and tax assumptions to explore various scenarios.
- Financial Statements: Comprehensive annual and quarterly breakdowns for enhanced insights.
- Key Ratios: Integrated analysis for profitability, efficiency, and leverage metrics.
- Dashboard with Visual Outputs: Charts and tables designed for clear and actionable outcomes.
Disclaimer
All information, articles, and product details provided on this website are for general informational and educational purposes only. We do not claim any ownership over, nor do we intend to infringe upon, any trademarks, copyrights, logos, brand names, or other intellectual property mentioned or depicted on this site. Such intellectual property remains the property of its respective owners, and any references here are made solely for identification or informational purposes, without implying any affiliation, endorsement, or partnership.
We make no representations or warranties, express or implied, regarding the accuracy, completeness, or suitability of any content or products presented. Nothing on this website should be construed as legal, tax, investment, financial, medical, or other professional advice. In addition, no part of this site—including articles or product references—constitutes a solicitation, recommendation, endorsement, advertisement, or offer to buy or sell any securities, franchises, or other financial instruments, particularly in jurisdictions where such activity would be unlawful.
All content is of a general nature and may not address the specific circumstances of any individual or entity. It is not a substitute for professional advice or services. Any actions you take based on the information provided here are strictly at your own risk. You accept full responsibility for any decisions or outcomes arising from your use of this website and agree to release us from any liability in connection with your use of, or reliance upon, the content or products found herein.