
|
Hansoh Pharmaceutical Group Company Limited (3692.HK) DCF Valuation |
Fully Editable: Tailor To Your Needs In Excel Or Sheets
Professional Design: Trusted, Industry-Standard Templates
Investor-Approved Valuation Models
MAC/PC Compatible, Fully Unlocked
No Expertise Is Needed; Easy To Follow
Hansoh Pharmaceutical Group Company Limited (3692.HK) Bundle
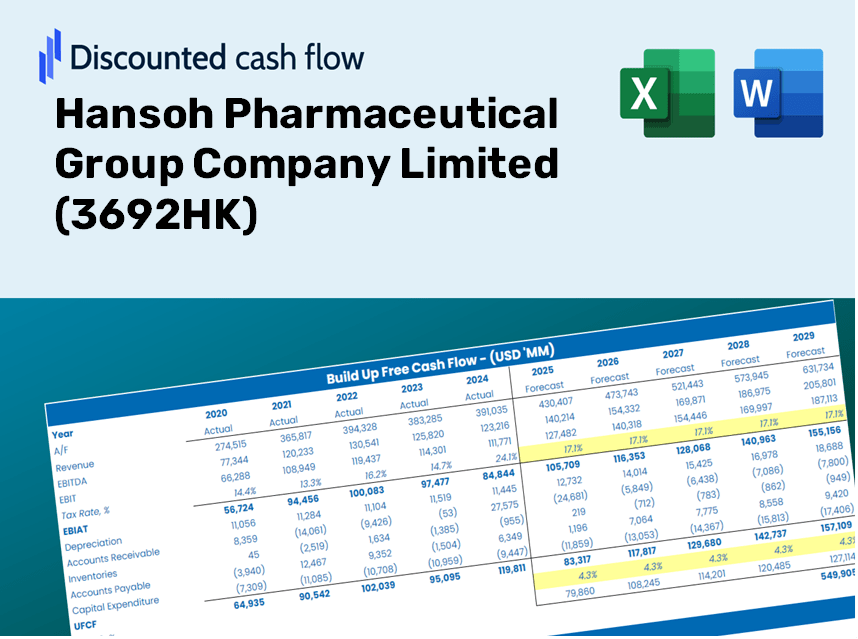
Evaluate the financial prospects of Hansoh Pharmaceutical Group Company Limited like an expert! This (3692HK) DCF Calculator provides you with pre-filled financial data and the flexibility to modify revenue growth, WACC, margins, and other essential assumptions to align with your projections.
Discounted Cash Flow (DCF) - (USD MM)
| Year | AY1 2020 |
AY2 2021 |
AY3 2022 |
AY4 2023 |
AY5 2024 |
FY1 2025 |
FY2 2026 |
FY3 2027 |
FY4 2028 |
FY5 2029 |
|---|---|---|---|---|---|---|---|---|---|---|
| Revenue | 9,493.4 | 10,853.3 | 10,249.5 | 11,037.6 | 13,393.9 | 14,659.6 | 16,045.0 | 17,561.2 | 19,220.7 | 21,037.0 |
| Revenue Growth, % | 0 | 14.33 | -5.56 | 7.69 | 21.35 | 9.45 | 9.45 | 9.45 | 9.45 | 9.45 |
| EBITDA | 3,265.5 | 3,369.0 | 3,202.8 | 4,587.3 | 4,673.0 | 5,076.3 | 5,556.0 | 6,081.0 | 6,655.6 | 7,284.6 |
| EBITDA, % | 34.4 | 31.04 | 31.25 | 41.56 | 34.89 | 34.63 | 34.63 | 34.63 | 34.63 | 34.63 |
| Depreciation | 236.3 | 304.2 | 354.4 | 400.2 | 410.3 | 452.7 | 495.4 | 542.3 | 593.5 | 649.6 |
| Depreciation, % | 2.49 | 2.8 | 3.46 | 3.63 | 3.06 | 3.09 | 3.09 | 3.09 | 3.09 | 3.09 |
| EBIT | 3,029.2 | 3,064.8 | 2,848.5 | 4,187.1 | 4,262.7 | 4,623.6 | 5,060.5 | 5,538.7 | 6,062.1 | 6,635.0 |
| EBIT, % | 31.91 | 28.24 | 27.79 | 37.93 | 31.83 | 31.54 | 31.54 | 31.54 | 31.54 | 31.54 |
| Total Cash | 14,994.8 | 20,692.0 | 23,629.7 | 27,154.3 | 25,547.6 | 14,659.6 | 16,045.0 | 17,561.2 | 19,220.7 | 21,037.0 |
| Total Cash, percent | .0 | .0 | .0 | .0 | .0 | .0 | .0 | .0 | .0 | .0 |
| Account Receivables | 3,416.5 | 4,015.7 | 3,909.1 | 3,526.2 | 3,487.8 | 4,958.3 | 5,426.9 | 5,939.7 | 6,501.0 | 7,115.3 |
| Account Receivables, % | 35.99 | 37 | 38.14 | 31.95 | 26.04 | 33.82 | 33.82 | 33.82 | 33.82 | 33.82 |
| Inventories | 326.3 | 448.0 | 489.3 | 629.0 | 711.4 | 684.6 | 749.3 | 820.1 | 897.6 | 982.4 |
| Inventories, % | 3.44 | 4.13 | 4.77 | 5.7 | 5.31 | 4.67 | 4.67 | 4.67 | 4.67 | 4.67 |
| Accounts Payable | 135.9 | 271.3 | 242.8 | 178.9 | 238.0 | 284.3 | 311.2 | 340.6 | 372.8 | 408.0 |
| Accounts Payable, % | 1.43 | 2.5 | 2.37 | 1.62 | 1.78 | 1.94 | 1.94 | 1.94 | 1.94 | 1.94 |
| Capital Expenditure | -1,559.6 | -502.5 | -298.0 | -239.9 | -242.5 | -819.5 | -896.9 | -981.7 | -1,074.4 | -1,176.0 |
| Capital Expenditure, % | -16.43 | -4.63 | -2.91 | -2.17 | -1.81 | -5.59 | -5.59 | -5.59 | -5.59 | -5.59 |
| Tax Rate, % | 14.03 | 14.03 | 14.03 | 14.03 | 14.03 | 14.03 | 14.03 | 14.03 | 14.03 | 14.03 |
| EBITAT | 2,511.6 | 2,519.5 | 2,496.1 | 3,643.8 | 3,664.7 | 3,937.0 | 4,309.0 | 4,716.2 | 5,161.9 | 5,649.7 |
| Depreciation | ||||||||||
| Changes in Account Receivables | ||||||||||
| Changes in Inventories | ||||||||||
| Changes in Accounts Payable | ||||||||||
| Capital Expenditure | ||||||||||
| UFCF | -2,418.6 | 1,735.6 | 2,589.4 | 3,983.4 | 3,847.7 | 2,172.8 | 3,401.2 | 3,722.6 | 4,074.4 | 4,459.4 |
| WACC, % | 6.6 | 6.6 | 6.6 | 6.6 | 6.6 | 6.6 | 6.6 | 6.6 | 6.6 | 6.6 |
| PV UFCF | ||||||||||
| SUM PV UFCF | 14,500.2 | |||||||||
| Long Term Growth Rate, % | 2.00 | |||||||||
| Free cash flow (T + 1) | 4,549 | |||||||||
| Terminal Value | 98,934 | |||||||||
| Present Terminal Value | 71,880 | |||||||||
| Enterprise Value | 86,381 | |||||||||
| Net Debt | -24,583 | |||||||||
| Equity Value | 110,964 | |||||||||
| Diluted Shares Outstanding, MM | 5,950 | |||||||||
| Equity Value Per Share | 18.65 |
What You Will Receive
- Customizable Excel Template: An adaptable Excel-based DCF Calculator featuring pre-filled financial data for Hansoh Pharmaceutical Group Company Limited (3692HK).
- Authentic Data: Access to historical performance metrics and forward-looking projections (highlighted in the yellow cells).
- Adjustable Forecasting: Modify key assumptions such as revenue growth, EBITDA %, and WACC to suit your analysis.
- Real-Time Calculations: Instantly observe how your inputs affect the valuation of Hansoh Pharmaceutical Group Company Limited (3692HK).
- Professional Resource: Designed for investors, CFOs, consultants, and financial analysts seeking detailed insights.
- Intuitive Design: Organized for simplicity and convenience, complemented by clear, step-by-step guidance.
Key Features
- Authentic Financial Data: Access reliable historical figures and future forecasts tailored for Hansoh Pharmaceutical Group Company Limited (3692HK).
- Editable Forecast Parameters: Adjust highlighted fields such as WACC, growth rates, and profit margins to suit your analysis.
- Real-Time Calculations: Automatically refresh DCF, Net Present Value (NPV), and cash flow assessments with updated inputs.
- User-Friendly Dashboard: Clear and concise visualizations to help you interpret your valuation insights effectively.
- Suitable for All Experience Levels: A straightforward design crafted for investors, CFOs, and consultants alike.
How It Functions
- Download the Template: Gain immediate access to the Excel-based Hansoh Pharmaceutical DCF Calculator.
- Input Your Assumptions: Modify the yellow-highlighted cells for growth rates, WACC, margins, and other parameters.
- Instant Calculations: The model automatically calculates the intrinsic value of Hansoh Pharmaceutical.
- Test Scenarios: Explore various assumptions to assess potential valuation impacts.
- Analyze and Decide: Utilize the outcomes to inform your investment or financial analysis decisions.
Why Choose This Calculator for Hansoh Pharmaceutical Group Company Limited (3692HK)?
- Comprehensive Tool: Combines DCF, WACC, and financial ratio analyses into a single, powerful resource.
- Customizable Inputs: Modify the yellow-highlighted cells to explore different financial scenarios.
- Detailed Insights: Automatically computes the intrinsic value and Net Present Value for Hansoh Pharmaceutical.
- Preloaded Data: Incorporates historical and projected data for accurate initial assessments.
- Professional Quality: Perfect for financial analysts, investors, and business consultants focused on (3692HK).
Who Should Use This Product?
- Individual Investors: Make informed decisions about buying or selling Hansoh Pharmaceutical Group Company Limited (3692HK) stock.
- Financial Analysts: Enhance valuation processes with ready-to-use financial models specific to Hansoh Pharmaceutical Group Company Limited (3692HK).
- Consultants: Provide clients with accurate and timely valuation insights related to Hansoh Pharmaceutical Group Company Limited (3692HK).
- Business Owners: Gain a better understanding of how major companies like Hansoh Pharmaceutical Group Company Limited (3692HK) are valued to inform your own business strategies.
- Finance Students: Explore valuation techniques using real-world data and scenarios surrounding Hansoh Pharmaceutical Group Company Limited (3692HK).
Contents of the Template
- Operating and Balance Sheet Data: Pre-filled historical data and forecasts for Hansoh Pharmaceutical Group Company Limited (3692HK), including revenue, EBITDA, EBIT, and capital expenditures.
- WACC Calculation: A dedicated sheet for the Weighted Average Cost of Capital (WACC), featuring parameters such as Beta, risk-free rate, and share price.
- DCF Valuation (Unlevered and Levered): Editable Discounted Cash Flow models that illustrate intrinsic value with comprehensive calculations.
- Financial Statements: Pre-loaded financial statements (annual and quarterly) to facilitate in-depth analysis.
- Key Ratios: Includes profitability, leverage, and efficiency ratios specific to Hansoh Pharmaceutical Group Company Limited (3692HK).
- Dashboard and Charts: A visual summary of valuation outputs and assumptions designed for easy analysis of results.
Disclaimer
All information, articles, and product details provided on this website are for general informational and educational purposes only. We do not claim any ownership over, nor do we intend to infringe upon, any trademarks, copyrights, logos, brand names, or other intellectual property mentioned or depicted on this site. Such intellectual property remains the property of its respective owners, and any references here are made solely for identification or informational purposes, without implying any affiliation, endorsement, or partnership.
We make no representations or warranties, express or implied, regarding the accuracy, completeness, or suitability of any content or products presented. Nothing on this website should be construed as legal, tax, investment, financial, medical, or other professional advice. In addition, no part of this site—including articles or product references—constitutes a solicitation, recommendation, endorsement, advertisement, or offer to buy or sell any securities, franchises, or other financial instruments, particularly in jurisdictions where such activity would be unlawful.
All content is of a general nature and may not address the specific circumstances of any individual or entity. It is not a substitute for professional advice or services. Any actions you take based on the information provided here are strictly at your own risk. You accept full responsibility for any decisions or outcomes arising from your use of this website and agree to release us from any liability in connection with your use of, or reliance upon, the content or products found herein.