
|
CALB Group Co., Ltd. (3931.HK) DCF Valuation |
Fully Editable: Tailor To Your Needs In Excel Or Sheets
Professional Design: Trusted, Industry-Standard Templates
Investor-Approved Valuation Models
MAC/PC Compatible, Fully Unlocked
No Expertise Is Needed; Easy To Follow
CALB Group Co., Ltd. (3931.HK) Bundle
Explore CALB Group Co., Ltd. (3931HK) financial future with our user-friendly DCF Calculator! Enter your assumptions for growth, margins, and costs to calculate CALB Group Co., Ltd. (3931HK) intrinsic value and enhance your investment strategy.
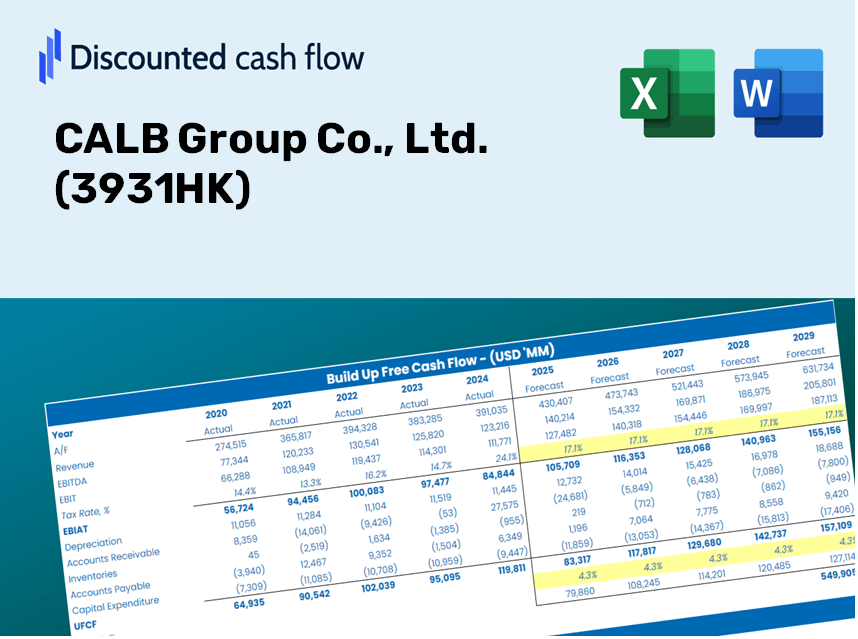
Discounted Cash Flow (DCF) - (USD MM)
| Year | AY1 2020 |
AY2 2021 |
AY3 2022 |
AY4 2023 |
AY5 2024 |
FY1 2025 |
FY2 2026 |
FY3 2027 |
FY4 2028 |
FY5 2029 |
|---|---|---|---|---|---|---|---|---|---|---|
| Revenue | 3,089.3 | 7,453.8 | 22,277.9 | 29,528.2 | 30,343.5 | 48,193.4 | 76,543.9 | 121,571.9 | 193,088.3 | 306,675.3 |
| Revenue Growth, % | 0 | 141.28 | 198.88 | 32.54 | 2.76 | 58.83 | 58.83 | 58.83 | 58.83 | 58.83 |
| EBITDA | 274.2 | 483.6 | 1,649.0 | 2,749.1 | 2,956.1 | 4,030.8 | 6,401.9 | 10,167.9 | 16,149.4 | 25,649.5 |
| EBITDA, % | 8.88 | 6.49 | 7.4 | 9.31 | 9.74 | 8.36 | 8.36 | 8.36 | 8.36 | 8.36 |
| Depreciation | 309.1 | 543.4 | 979.2 | 1,913.7 | 1,815.2 | 3,292.2 | 5,228.8 | 8,304.8 | 13,190.1 | 20,949.4 |
| Depreciation, % | 10.01 | 7.29 | 4.4 | 6.48 | 5.98 | 6.83 | 6.83 | 6.83 | 6.83 | 6.83 |
| EBIT | -34.9 | -59.8 | 669.8 | 835.4 | 1,140.9 | 738.6 | 1,173.1 | 1,863.2 | 2,959.2 | 4,700.0 |
| EBIT, % | -1.13 | -0.80292 | 3.01 | 2.83 | 3.76 | 1.53 | 1.53 | 1.53 | 1.53 | 1.53 |
| Total Cash | 4,698.3 | 10,160.0 | 12,146.5 | 8,722.7 | 11,910.5 | 31,163.3 | 49,495.6 | 78,612.0 | 124,856.7 | 198,305.4 |
| Total Cash, percent | .0 | .0 | .0 | .0 | .0 | .0 | .0 | .0 | .0 | .0 |
| Account Receivables | 2,056.4 | 3,857.1 | 6,894.7 | 7,721.4 | 10,990.4 | 20,398.2 | 32,397.7 | 51,456.2 | 81,726.0 | 129,802.4 |
| Account Receivables, % | 66.56 | 51.75 | 30.95 | 26.15 | 36.22 | 42.33 | 42.33 | 42.33 | 42.33 | 42.33 |
| Inventories | 831.3 | 1,920.9 | 12,926.1 | 7,791.3 | 5,755.0 | 15,041.6 | 23,890.1 | 37,943.7 | 60,264.7 | 95,716.2 |
| Inventories, % | 26.91 | 25.77 | 58.02 | 26.39 | 18.97 | 31.21 | 31.21 | 31.21 | 31.21 | 31.21 |
| Accounts Payable | 2,904.9 | 6,906.8 | 23,668.5 | 21,823.0 | 21,306.5 | 41,524.9 | 65,952.4 | 104,749.9 | 166,370.5 | 264,240.3 |
| Accounts Payable, % | 94.03 | 92.66 | 106.24 | 73.91 | 70.22 | 86.16 | 86.16 | 86.16 | 86.16 | 86.16 |
| Capital Expenditure | -3,999.1 | -14,375.1 | -40,212.3 | -22,009.0 | -18,157.6 | -41,868.1 | -66,497.7 | -105,615.8 | -167,745.8 | -266,424.7 |
| Capital Expenditure, % | -129.45 | -192.86 | -180.5 | -74.54 | -59.84 | -86.88 | -86.88 | -86.88 | -86.88 | -86.88 |
| Tax Rate, % | 25.18 | 25.18 | 25.18 | 25.18 | 25.18 | 25.18 | 25.18 | 25.18 | 25.18 | 25.18 |
| EBITAT | -41.9 | -132.1 | 717.5 | 567.2 | 853.6 | 654.0 | 1,038.7 | 1,649.7 | 2,620.1 | 4,161.5 |
| Depreciation | ||||||||||
| Changes in Account Receivables | ||||||||||
| Changes in Inventories | ||||||||||
| Changes in Accounts Payable | ||||||||||
| Capital Expenditure | ||||||||||
| UFCF | -3,714.7 | -12,852.0 | -35,796.7 | -17,065.7 | -17,238.0 | -36,398.1 | -56,650.5 | -89,976.0 | -142,905.7 | -226,972.0 |
| WACC, % | 5.57 | 5.57 | 5.57 | 5.02 | 5.14 | 5.37 | 5.37 | 5.37 | 5.37 | 5.37 |
| PV UFCF | ||||||||||
| SUM PV UFCF | -453,080.0 | |||||||||
| Long Term Growth Rate, % | 2.00 | |||||||||
| Free cash flow (T + 1) | -231,511 | |||||||||
| Terminal Value | -6,862,276 | |||||||||
| Present Terminal Value | -5,282,110 | |||||||||
| Enterprise Value | -5,735,190 | |||||||||
| Net Debt | 40,629 | |||||||||
| Equity Value | -5,775,819 | |||||||||
| Diluted Shares Outstanding, MM | 1,772 | |||||||||
| Equity Value Per Share | -3,258.94 |
Benefits You Will Enjoy
- Authentic CALB Financials: Offers historical and projected data for precise valuation.
- Customizable Inputs: Adjust WACC, tax rates, revenue growth, and capital expenditures as needed.
- Instant Calculations: Intrinsic value and NPV are updated automatically.
- Scenario Analysis: Explore various scenarios to assess CALB Group's future performance.
- User-Friendly Design: Crafted for experts yet easy for newcomers to navigate.
Key Features
- Comprehensive DCF Calculator: Features detailed unlevered and levered DCF valuation models tailored for CALB Group Co., Ltd. (3931HK).
- WACC Calculation Tool: Equipped with a pre-formatted Weighted Average Cost of Capital sheet that allows for customizable inputs.
- Customizable Forecast Assumptions: Adjust growth rates, capital expenditures, and discount rates to fit your analysis.
- Integrated Financial Ratios: Evaluate profitability, leverage, and efficiency ratios specifically for CALB Group Co., Ltd. (3931HK).
- Interactive Dashboard and Visuals: Offers graphical summaries of key valuation metrics for streamlined analysis.
How It Operates
- 1. Access the Template: Download and open the Excel file containing CALB Group Co., Ltd.'s preloaded data.
- 2. Modify Assumptions: Adjust key parameters such as growth rates, WACC, and capital expenditures.
- 3. Instant Results: The DCF model automatically computes intrinsic value and NPV in real-time.
- 4. Explore Scenarios: Evaluate various forecasts to investigate different valuation possibilities.
- 5. Present with Assurance: Share professional valuation analyses to reinforce your decision-making.
Why Select This Calculator for CALB Group Co., Ltd. (3931HK)?
- Reliable Information: Up-to-date CALB financial data ensure trustworthy valuation outcomes.
- Tailorable Options: Modify essential variables such as growth rates, WACC, and tax rates to fit your forecasts.
- Efficiency Boost: Pre-made calculations save you the hassle of building from the ground up.
- Professional-Quality Tool: Crafted for investors, analysts, and consultants alike.
- User-Friendly Design: An intuitive interface and clear instructions make navigation effortless for all users.
Who is This Product Designed For?
- Investors: Evaluate CALB Group Co., Ltd.’s (3931HK) valuation prior to making buy or sell decisions.
- CFOs and Financial Analysts: Enhance the efficiency of valuation processes and assess forecasts.
- Startup Founders: Understand the valuation methodologies applied to leading public enterprises like CALB Group Co., Ltd.
- Consultants: Create comprehensive valuation reports for clients involving CALB Group Co., Ltd. (3931HK).
- Students and Educators: Utilize real-world data from CALB Group Co., Ltd. (3931HK) to practice and instruct on valuation techniques.
What the Template Includes
- Pre-Filled DCF Model: CALB Group's financial data ready for immediate analysis.
- WACC Calculator: Comprehensive calculations for Weighted Average Cost of Capital.
- Financial Ratios: Assess CALB Group's profitability, leverage, and operational efficiency.
- Editable Inputs: Modify assumptions such as growth rates, margins, and capital expenditures to align with your scenarios.
- Financial Statements: Access annual and quarterly reports for thorough evaluation.
- Interactive Dashboard: Easily visualize essential valuation metrics and outcomes.
Disclaimer
All information, articles, and product details provided on this website are for general informational and educational purposes only. We do not claim any ownership over, nor do we intend to infringe upon, any trademarks, copyrights, logos, brand names, or other intellectual property mentioned or depicted on this site. Such intellectual property remains the property of its respective owners, and any references here are made solely for identification or informational purposes, without implying any affiliation, endorsement, or partnership.
We make no representations or warranties, express or implied, regarding the accuracy, completeness, or suitability of any content or products presented. Nothing on this website should be construed as legal, tax, investment, financial, medical, or other professional advice. In addition, no part of this site—including articles or product references—constitutes a solicitation, recommendation, endorsement, advertisement, or offer to buy or sell any securities, franchises, or other financial instruments, particularly in jurisdictions where such activity would be unlawful.
All content is of a general nature and may not address the specific circumstances of any individual or entity. It is not a substitute for professional advice or services. Any actions you take based on the information provided here are strictly at your own risk. You accept full responsibility for any decisions or outcomes arising from your use of this website and agree to release us from any liability in connection with your use of, or reliance upon, the content or products found herein.