
|
Showa Denko K.K. (4004.T): BCG Matrix |
Fully Editable: Tailor To Your Needs In Excel Or Sheets
Professional Design: Trusted, Industry-Standard Templates
Investor-Approved Valuation Models
MAC/PC Compatible, Fully Unlocked
No Expertise Is Needed; Easy To Follow
Showa Denko K.K. (4004.T) Bundle
In the ever-evolving landscape of chemical manufacturing, Showa Denko K.K. stands out with a diverse portfolio, expertly categorized through the Boston Consulting Group Matrix. Understanding where each segment—Stars, Cash Cows, Dogs, and Question Marks—fits can illuminate the company's strategic positioning and growth potential. Dive in as we explore the various dynamics at play within Showa Denko's business model and discover what the future may hold for this industrial giant.
Background of Showa Denko K.K.
Showa Denko K.K., founded in 1921, is a leading Japanese manufacturer specialized in chemicals and advanced materials. Headquartered in Tokyo, the company operates within multiple segments, including Chemicals, Electronics, and Metals.
As of 2023, Showa Denko has reported revenues of approximately ¥1.13 trillion (around $10.3 billion), showcasing its broad market reach. The company is renowned for its production of semiconductor materials, resin products, and various industrial chemicals, which positions it firmly in technology-driven and environmentally conscious sectors.
In recent years, Showa Denko has made significant strides in sustainability, highlighting its commitment to reducing carbon emissions by 30% by 2030. This aligns with global trends emphasizing the importance of eco-friendly practices in manufacturing.
With a robust R&D framework, Showa Denko invests heavily in innovation, spending 7.3% of its annual revenue on research and development as of the latest fiscal year. This proactive approach is critical in maintaining competitive advantage, particularly in the rapidly evolving tech landscape.
The company operates through an extensive global network with production facilities located across Japan, the United States, Germany, and China, effectively serving a diverse clientele that spans multiple industries. Each facility leverages cutting-edge technology to optimize production processes, ensuring high-quality output.
Showa Denko's stock is traded on the Tokyo Stock Exchange under the ticker symbol 4004, with a market capitalization hovering around ¥900 billion (approximately $8 billion). The stock performance has shown resilience, reflecting the company's strategic pivots into high-demand sectors.
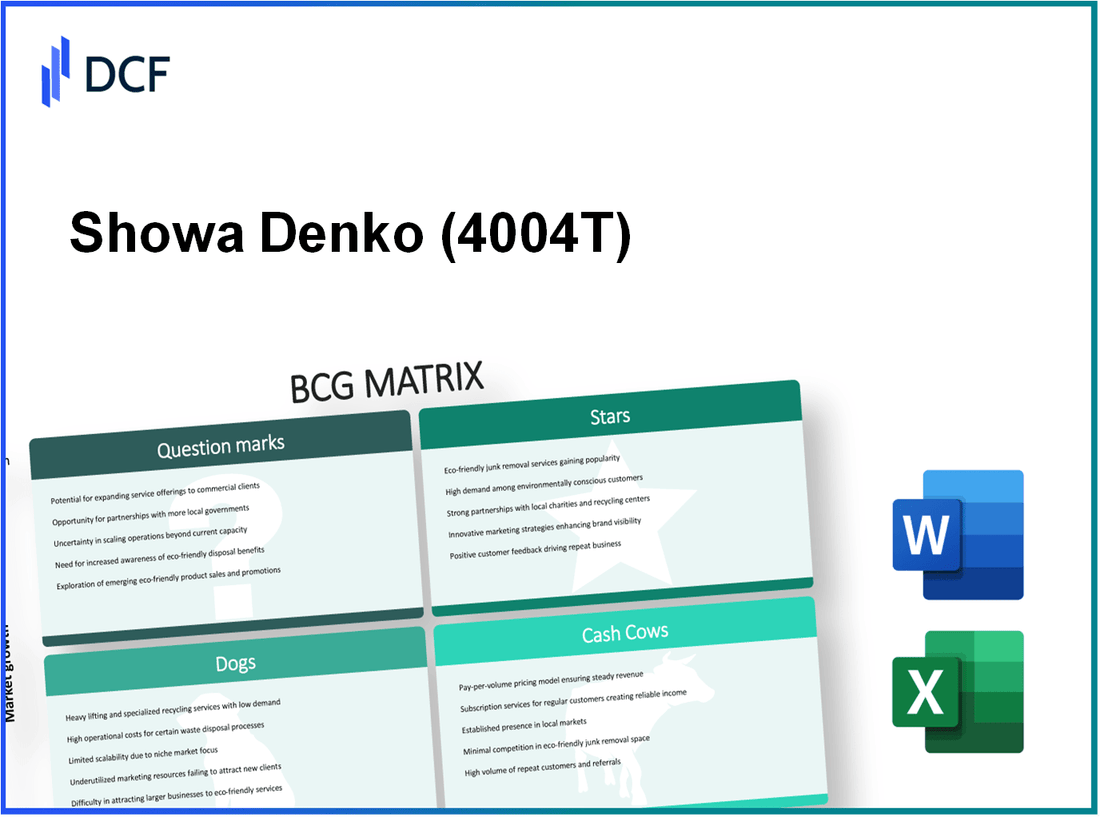
Showa Denko K.K. - BCG Matrix: Stars
Advanced Battery Materials
Showa Denko K.K. is a key player in the advanced battery materials market, particularly with its lithium-ion battery (LIB) products. In the fiscal year 2022, the segment generated sales of approximately ¥147.1 billion, marking a growth of 28% year-over-year.
The company's development of high-performance anode materials has positioned it well within the rapidly expanding electric vehicle (EV) market, which is projected to grow at a CAGR of 20.2% from 2023 to 2030.
| Year | Sales (¥ billion) | Growth Rate (%) | Market CAGR (%) |
|---|---|---|---|
| 2020 | 95.0 | - | - |
| 2021 | 115.0 | 21.1 | - |
| 2022 | 147.1 | 28.0 | 20.2 |
Semiconductor Materials
The semiconductor materials segment has been a significant growth driver for Showa Denko, contributing ¥163.5 billion in sales for the year 2022, representing a remarkable growth of 25% compared to 2021.
The increasing demand for semiconductors in various industries, including automotive and consumer electronics, has bolstered the segment’s market position. The global semiconductor market is expected to grow at a CAGR of 5.6% from 2023 to 2030, placing pressure on Showa Denko to maintain its competitive edge.
| Year | Sales (¥ billion) | Growth Rate (%) | Market CAGR (%) |
|---|---|---|---|
| 2020 | 120.0 | - | - |
| 2021 | 130.8 | 9.0 | - |
| 2022 | 163.5 | 25.0 | 5.6 |
Electronic Chemicals
Showa Denko also operates in the electronic chemicals sector, with revenue reaching ¥112.3 billion in 2022, a noteworthy increase of 20% from the previous year.
This segment benefits from the sustained growth in the semiconductor and electronics markets. Moreover, the electronic chemicals market is forecasted to grow at a CAGR of 6.5% through 2025, presenting opportunities for Showa Denko to capture more market share.
| Year | Sales (¥ billion) | Growth Rate (%) | Market CAGR (%) |
|---|---|---|---|
| 2020 | 90.0 | - | - |
| 2021 | 93.5 | 3.9 | - |
| 2022 | 112.3 | 20.0 | 6.5 |
Showa Denko K.K. - BCG Matrix: Cash Cows
Industrial Gases
Showa Denko K.K. holds a significant market position in the industrial gases segment. In the 2022 fiscal year, the company reported revenue from industrial gases amounting to approximately ¥99.4 billion, with an operating profit margin of around 21%. This segment accounts for about 30% of the total sales for the company, indicating a strong market presence despite the low-growth environment.
With the demand for industrial gases remaining stable, Showa Denko benefits from high margins and robust cash flow. The company has achieved a strong return on investment in this segment through ongoing operational efficiencies. The market for industrial gases is characterized by its maturity, allowing Showa Denko to focus on maximizing profitability with minimal capital investments.
Petrochemicals
The petrochemical division is another cash cow for Showa Denko. In 2022, the petrochemical segment generated revenues of approximately ¥154 billion, representing a substantial portion of the company’s overall earnings. The operating profit for this segment was reported at around 23%, showcasing its ability to produce high-profit margins.
The petrochemicals market is also mature, with Showa Denko holding a significant share, estimated at 17% within the Japanese market. The company focuses on high-value-added products such as phenol and acetone, which contribute to stable cash flows and lower volatility in earnings. The relatively low growth in this sector allows Showa Denko to maintain a disciplined capital expenditure approach while continuing to fund research and development and paying dividends to shareholders.
| Segment | Revenue (¥ billion) | Operating Profit Margin (%) | Market Share (%) | Growth Rate (%) |
|---|---|---|---|---|
| Industrial Gases | 99.4 | 21 | 30 | 2 |
| Petrochemicals | 154 | 23 | 17 | 1.5 |
In conclusion, Showa Denko’s industrial gases and petrochemical segments exemplify cash cow characteristics. By leveraging high market share and strong profit margins, these business units not only support the broader company operations but also play a critical role in sustaining cash flow for further strategic investments.
Showa Denko K.K. - BCG Matrix: Dogs
In the context of Showa Denko K.K., two key business segments classified as Dogs within the BCG Matrix are Aluminum Cans and Commodity Chemicals. Both segments operate in low growth markets while maintaining a low market share.
Aluminum Cans
The aluminum cans segment has struggled to achieve significant growth. The market for aluminum cans is characterized by saturation and intense competition, leading to limited expansion opportunities. In the fiscal year ending December 2022, Showa Denko reported a revenue of approximately ¥32 billion from aluminum can production, reflecting a marginal increase of 1.5% compared to the previous year, indicating a lack of robust growth potential.
Additionally, the profit margins in this segment are often under pressure due to fluctuating raw material costs and significant competition from other manufacturers. Showa Denko's market share in the aluminum can sector is approximately 5%, positioning it significantly behind larger competitors. This low market share, coupled with the stagnating growth in the overall aluminum can market, renders it a prime candidate for reconsideration or divestiture.
Commodity Chemicals
The commodity chemicals segment of Showa Denko is another area classified as a Dog. This segment has demonstrated low growth and market share over the past several years. In 2022, revenue from commodity chemicals was reported at about ¥50 billion, which is relatively stable but lacks the growth momentum seen in other chemical sectors.
Showa Denko's market share in commodity chemicals stands at around 3%, which is considerably lower than key players in the industry. The chemical market is grappling with declining prices and increasing costs, leading to squeezed margins. The average EBITDA margin for commodity chemicals is approximately 8%, indicating that the segment struggles to generate significant profits.
| Segment | Revenue (FY 2022) | Market Share | Growth Rate | EBITDA Margin |
|---|---|---|---|---|
| Aluminum Cans | ¥32 billion | 5% | 1.5% | 6% |
| Commodity Chemicals | ¥50 billion | 3% | 0% | 8% |
The financial performance of both segments underscores their classification as Dogs within Showa Denko's portfolio. The lack of substantial returns on investment and the presence of a stagnant market landscape suggest that resources allocated to these segments could possibly be redirected towards more promising opportunities within the company.
Showa Denko K.K. - BCG Matrix: Question Marks
Showa Denko K.K. operates in various segments, and within the BCG Matrix, certain business units are classified as Question Marks. These segments, while positioned in growing markets, have not yet achieved significant market share.
Biodegradable Plastics
Showa Denko's biodegradable plastics segment is a burgeoning area. The global biodegradable plastics market was valued at approximately $2.78 billion in 2021 and is projected to grow at a CAGR of 9.5% from 2022 to 2030.
Despite this growth potential, Showa Denko's market share in the biodegradable plastics category is relatively low, estimated at around 2% of the total market. This gap indicates substantial challenges in brand awareness and acceptance among consumers.
Sustainable Packaging Solutions
The sustainable packaging solutions offered by Showa Denko represent another Question Mark. The sustainable packaging market is anticipated to reach a value of around $570 billion by 2027, growing at a CAGR of approximately 5.7% during the forecast period.
Showa Denko currently holds less than 1% of this market, highlighting their low market share relative to the high growth prospects. The company faces the dual challenge of increasing production capabilities and enhancing marketing strategies to gain consumer traction.
Next-Gen Display Materials
Showa Denko's involvement in next-gen display materials is marked by rapid advancement in technology and innovation. The global display materials market is projected to exceed $21 billion by 2025, with a CAGR of around 5.2% from 2020 to 2025.
Currently, Showa Denko's market share in this sector remains low, estimated at approximately 3%. This signifies a critical need for investment in research and development along with aggressive marketing to capitalize on the growing demand for advanced display technologies.
| Segment | Market Size (2021) | Projected Growth Rate (CAGR) | Current Market Share |
|---|---|---|---|
| Biodegradable Plastics | $2.78 billion | 9.5% | 2% |
| Sustainable Packaging Solutions | $570 billion (by 2027) | 5.7% | 1% |
| Next-Gen Display Materials | $21 billion (by 2025) | 5.2% | 3% |
These segments, categorized as Question Marks, consume a considerable amount of cash while offering limited returns due to their low market shares. The viability of these product lines hinges on Showa Denko's strategic decisions, whether to invest further to increase market share or to divest if market potential does not materialize.
The Boston Consulting Group Matrix provides a strategic lens through which to view Showa Denko K.K.'s business segments, highlighting the robust growth and profitability of its Stars like Advanced Battery Materials and Semiconductor Materials, while emphasizing the steady revenue generation from Cash Cows such as Industrial Gases. Meanwhile, the underperforming Dogs like Aluminum Cans indicate potential areas for strategic reevaluation, and the Question Marks present exciting opportunities for future innovation that could drive sustainability in the industry.
[right_small]Disclaimer
All information, articles, and product details provided on this website are for general informational and educational purposes only. We do not claim any ownership over, nor do we intend to infringe upon, any trademarks, copyrights, logos, brand names, or other intellectual property mentioned or depicted on this site. Such intellectual property remains the property of its respective owners, and any references here are made solely for identification or informational purposes, without implying any affiliation, endorsement, or partnership.
We make no representations or warranties, express or implied, regarding the accuracy, completeness, or suitability of any content or products presented. Nothing on this website should be construed as legal, tax, investment, financial, medical, or other professional advice. In addition, no part of this site—including articles or product references—constitutes a solicitation, recommendation, endorsement, advertisement, or offer to buy or sell any securities, franchises, or other financial instruments, particularly in jurisdictions where such activity would be unlawful.
All content is of a general nature and may not address the specific circumstances of any individual or entity. It is not a substitute for professional advice or services. Any actions you take based on the information provided here are strictly at your own risk. You accept full responsibility for any decisions or outcomes arising from your use of this website and agree to release us from any liability in connection with your use of, or reliance upon, the content or products found herein.