
|
Nissan Chemical Corporation (4021.T) DCF Valuation |
Fully Editable: Tailor To Your Needs In Excel Or Sheets
Professional Design: Trusted, Industry-Standard Templates
Investor-Approved Valuation Models
MAC/PC Compatible, Fully Unlocked
No Expertise Is Needed; Easy To Follow
Nissan Chemical Corporation (4021.T) Bundle
Streamline your analysis and improve precision with our (4021T) DCF Calculator! Utilizing real Nissan Chemical Corporation data and customizable assumptions, this tool empowers you to forecast, analyze, and value (4021T) like a seasoned investor.
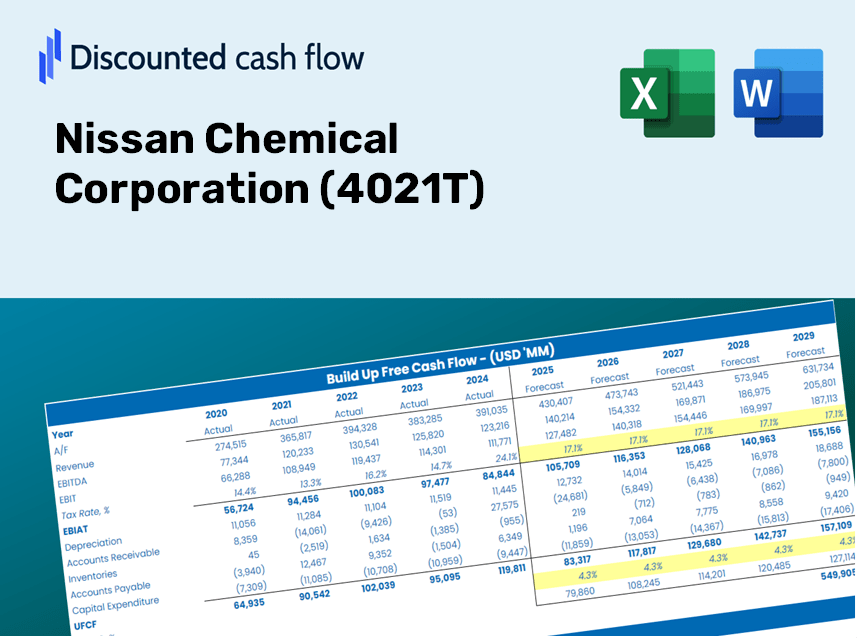
Discounted Cash Flow (DCF) - (USD MM)
| Year | AY1 2021 |
AY2 2022 |
AY3 2023 |
AY4 2024 |
AY5 2025 |
FY1 2026 |
FY2 2027 |
FY3 2028 |
FY4 2029 |
FY5 2030 |
|---|---|---|---|---|---|---|---|---|---|---|
| Revenue | 209,121.0 | 207,972.0 | 228,065.0 | 226,705.0 | 251,365.0 | 263,551.9 | 276,329.7 | 289,727.0 | 303,773.9 | 318,501.7 |
| Revenue Growth, % | 0 | -0.54944 | 9.66 | -0.59632 | 10.88 | 4.85 | 4.85 | 4.85 | 4.85 | 4.85 |
| EBITDA | 55,974.0 | 64,455.0 | 67,836.0 | 66,112.0 | 74,553.0 | 77,128.0 | 80,867.3 | 84,788.0 | 88,898.8 | 93,208.9 |
| EBITDA, % | 26.77 | 30.99 | 29.74 | 29.16 | 29.66 | 29.26 | 29.26 | 29.26 | 29.26 | 29.26 |
| Depreciation | 10,424.0 | 10,222.0 | 10,979.0 | 13,801.0 | 14,372.0 | 13,978.2 | 14,656.0 | 15,366.5 | 16,111.5 | 16,892.7 |
| Depreciation, % | 4.98 | 4.92 | 4.81 | 6.09 | 5.72 | 5.3 | 5.3 | 5.3 | 5.3 | 5.3 |
| EBIT | 45,550.0 | 54,233.0 | 56,857.0 | 52,311.0 | 60,181.0 | 63,149.7 | 66,211.4 | 69,421.5 | 72,787.3 | 76,316.2 |
| EBIT, % | 21.78 | 26.08 | 24.93 | 23.07 | 23.94 | 23.96 | 23.96 | 23.96 | 23.96 | 23.96 |
| Total Cash | 32,380.0 | 34,658.0 | 29,647.0 | 22,738.0 | 27,454.0 | 34,841.4 | 36,530.6 | 38,301.7 | 40,158.7 | 42,105.7 |
| Total Cash, percent | .0 | .0 | .0 | .0 | .0 | .0 | .0 | .0 | .0 | .0 |
| Account Receivables | 77,319.0 | 84,344.0 | 87,871.0 | 93,908.0 | 93,470.0 | 102,609.0 | 107,583.8 | 112,799.8 | 118,268.7 | 124,002.7 |
| Account Receivables, % | 36.97 | 40.56 | 38.53 | 41.42 | 37.18 | 38.93 | 38.93 | 38.93 | 38.93 | 38.93 |
| Inventories | 46,650.0 | 52,175.0 | 64,671.0 | 78,179.0 | 80,148.0 | 74,912.8 | 78,544.8 | 82,352.9 | 86,345.6 | 90,531.9 |
| Inventories, % | 22.31 | 25.09 | 28.36 | 34.48 | 31.89 | 28.42 | 28.42 | 28.42 | 28.42 | 28.42 |
| Accounts Payable | 16,298.0 | 19,043.0 | 19,942.0 | 20,427.0 | 19,877.0 | 22,461.0 | 23,550.0 | 24,691.8 | 25,888.9 | 27,144.1 |
| Accounts Payable, % | 7.79 | 9.16 | 8.74 | 9.01 | 7.91 | 8.52 | 8.52 | 8.52 | 8.52 | 8.52 |
| Capital Expenditure | -9,540.0 | -12,852.0 | -20,173.0 | -20,998.0 | -16,173.0 | -18,597.9 | -19,499.6 | -20,445.0 | -21,436.3 | -22,475.5 |
| Capital Expenditure, % | -4.56 | -6.18 | -8.85 | -9.26 | -6.43 | -7.06 | -7.06 | -7.06 | -7.06 | -7.06 |
| Tax Rate, % | 27.62 | 27.62 | 27.62 | 27.62 | 27.62 | 27.62 | 27.62 | 27.62 | 27.62 | 27.62 |
| EBITAT | 33,520.8 | 38,828.3 | 41,269.9 | 38,419.3 | 43,556.6 | 45,921.4 | 48,147.9 | 50,482.2 | 52,929.7 | 55,495.9 |
| Depreciation | ||||||||||
| Changes in Account Receivables | ||||||||||
| Changes in Inventories | ||||||||||
| Changes in Accounts Payable | ||||||||||
| Capital Expenditure | ||||||||||
| UFCF | -73,266.2 | 26,393.3 | 16,951.9 | 12,162.3 | 39,674.6 | 39,981.9 | 35,786.4 | 37,521.4 | 39,340.6 | 41,247.9 |
| WACC, % | 4.93 | 4.92 | 4.93 | 4.93 | 4.93 | 4.93 | 4.93 | 4.93 | 4.93 | 4.93 |
| PV UFCF | ||||||||||
| SUM PV UFCF | 167,978.9 | |||||||||
| Long Term Growth Rate, % | 2.00 | |||||||||
| Free cash flow (T + 1) | 42,073 | |||||||||
| Terminal Value | 1,437,684 | |||||||||
| Present Terminal Value | 1,130,418 | |||||||||
| Enterprise Value | 1,298,397 | |||||||||
| Net Debt | 13,020 | |||||||||
| Equity Value | 1,285,377 | |||||||||
| Diluted Shares Outstanding, MM | 137 | |||||||||
| Equity Value Per Share | 9,354.66 |
What You Will Receive
- Authentic Nissan Data: Preloaded financials – covering everything from revenue to EBIT – based on real and forecasted figures.
- Comprehensive Customization: Modify all essential parameters (yellow cells) such as WACC, growth %, and tax rates.
- Instant Valuation Adjustments: Automatic recalculations to evaluate the effects of changes on Nissan Chemical Corporation’s fair value.
- Flexible Excel Template: Designed for easy modifications, scenario analysis, and in-depth projections.
- Efficient and Precise: Avoid the hassle of building models from the ground up while enjoying accuracy and adaptability.
Key Features
- Comprehensive 4021T Data: Pre-loaded with Nissan Chemical Corporation’s historical financial performance and future growth projections.
- Highly Customizable Parameters: Modify revenue growth rates, profit margins, discount rates, tax assumptions, and capital investments.
- Dynamic Valuation Framework: Automatically refreshes Net Present Value (NPV) and intrinsic value estimates based on your custom inputs.
- Scenario Analysis: Develop various forecast scenarios to explore different valuation possibilities.
- User-Centric Interface: Intuitive, organized, and designed to cater to both experienced professionals and newcomers.
How It Operates
- 1. Access the Template: Download and open the Excel file featuring Nissan Chemical Corporation’s (4021T) preloaded data.
- 2. Adjust Inputs: Modify essential parameters such as growth rates, WACC, and capital expenditures.
- 3. Analyze Results Immediately: The DCF model will automatically compute intrinsic value and NPV.
- 4. Explore Different Scenarios: Evaluate various forecasts to examine alternative valuation results.
- 5. Present with Assurance: Provide professional valuation insights that bolster your decision-making process.
Why Opt for This Calculator?
- Time-Efficient: No need to build a DCF model from the ground up – it’s ready for immediate use.
- Enhanced Accuracy: Dependable financial data and formulas minimize valuation errors.
- Completely Customizable: Adjust the model to align with your assumptions and forecasts.
- User-Friendly: Intuitive charts and outputs simplify the analysis of results.
- Recommended by Professionals: Created for experts who prioritize precision and functionality.
Who Should Utilize This Product?
- Investors: Effectively determine Nissan Chemical Corporation's (4021T) fair value prior to making investment choices.
- CFOs: Utilize a top-tier DCF model for accurate financial reporting and analysis.
- Consultants: Seamlessly modify the template for client valuation reports.
- Entrepreneurs: Acquire insights into the financial modeling practices of leading corporations.
- Educators: Employ it as a resource to teach valuation techniques.
Contents of the Template
- Pre-Filled Data: Contains Nissan Chemical Corporation's historical financials and projections.
- Discounted Cash Flow Model: Editable DCF valuation model featuring automatic calculations.
- Weighted Average Cost of Capital (WACC): A specific sheet for determining WACC using custom inputs.
- Key Financial Ratios: Assess Nissan Chemical Corporation's profitability, efficiency, and leverage.
- Customizable Inputs: Easily adjust revenue growth, margins, and tax rates.
- Clear Dashboard: Visuals and tables summarizing essential valuation outcomes.
Disclaimer
All information, articles, and product details provided on this website are for general informational and educational purposes only. We do not claim any ownership over, nor do we intend to infringe upon, any trademarks, copyrights, logos, brand names, or other intellectual property mentioned or depicted on this site. Such intellectual property remains the property of its respective owners, and any references here are made solely for identification or informational purposes, without implying any affiliation, endorsement, or partnership.
We make no representations or warranties, express or implied, regarding the accuracy, completeness, or suitability of any content or products presented. Nothing on this website should be construed as legal, tax, investment, financial, medical, or other professional advice. In addition, no part of this site—including articles or product references—constitutes a solicitation, recommendation, endorsement, advertisement, or offer to buy or sell any securities, franchises, or other financial instruments, particularly in jurisdictions where such activity would be unlawful.
All content is of a general nature and may not address the specific circumstances of any individual or entity. It is not a substitute for professional advice or services. Any actions you take based on the information provided here are strictly at your own risk. You accept full responsibility for any decisions or outcomes arising from your use of this website and agree to release us from any liability in connection with your use of, or reliance upon, the content or products found herein.