
|
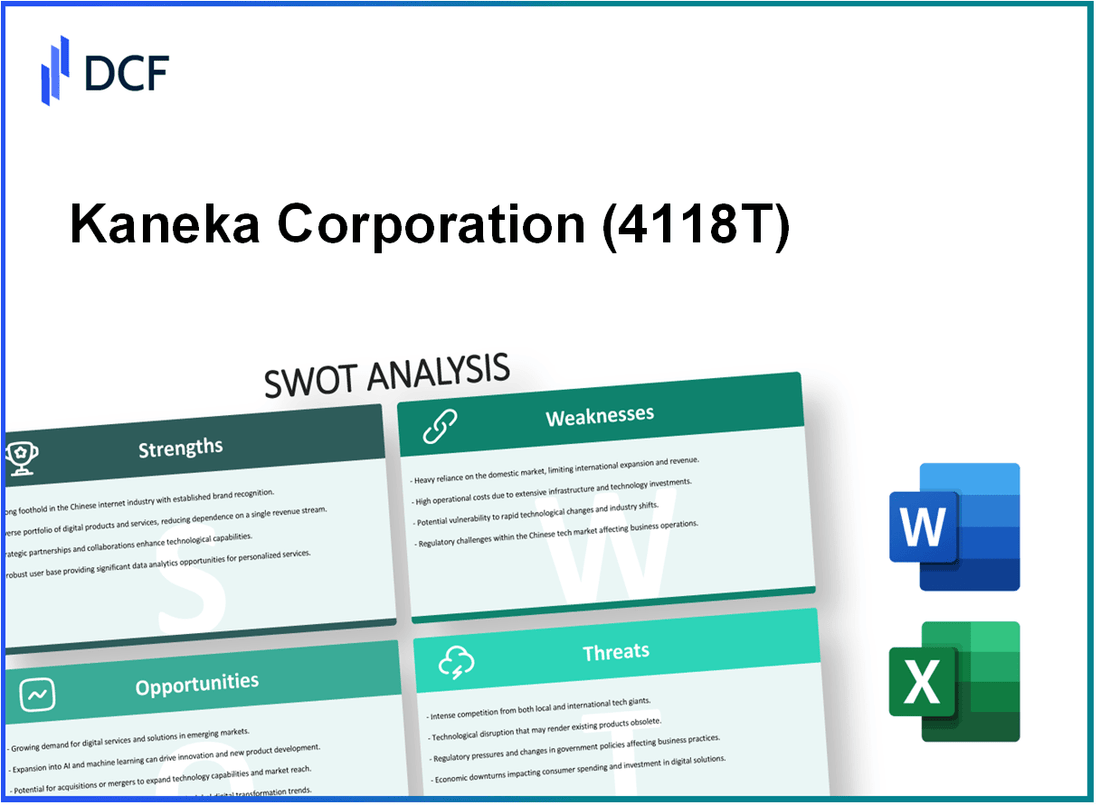
Kaneka Corporation (4118.T): SWOT Analysis |
Fully Editable: Tailor To Your Needs In Excel Or Sheets
Professional Design: Trusted, Industry-Standard Templates
Investor-Approved Valuation Models
MAC/PC Compatible, Fully Unlocked
No Expertise Is Needed; Easy To Follow
Kaneka Corporation (4118.T) Bundle
Kaneka Corporation, a multifaceted leader in materials and biotechnology, operates in an ever-evolving market landscape. Understanding its competitive position and strategic planning requires a deep dive into its strengths, weaknesses, opportunities, and threats. This SWOT analysis illuminates the pathways Kaneka can take to thrive amid challenges and capitalize on growth potential. Read on to unravel the intricate dynamics that define its business strategy.
Kaneka Corporation - SWOT Analysis: Strengths
Kaneka Corporation has a diversified product portfolio that spans various sectors, including chemicals, food, pharmaceuticals, and biotechnology. As of the fiscal year 2023, Kaneka reported a sales revenue of ¥756.8 billion (approximately $5.4 billion), with significant contributions from its Life Science Division, which accounted for about 26% of total sales. This diversification reduces risk and provides multiple revenue streams.
The company’s strong R&D capabilities have resulted in innovative solutions that cater to market demands. In fiscal year 2022, Kaneka invested approximately 6.3% of its total revenue into research and development, equating to around ¥47.8 billion (approximately $340 million). This investment supports product development in high-growth areas such as bioplastics and healthcare technology.
Kaneka has an established global presence with a robust distribution network spanning over 20 countries. The company operates several manufacturing facilities in Japan, Europe, and North America. In 2022, Kaneka reported international sales comprising 42% of total revenue, demonstrating its successful global strategy. This extensive network enables Kaneka to meet customer demands promptly and adapt to local market conditions.
Furthermore, Kaneka's commitment to sustainability and eco-friendly initiatives is evident in its product offerings and strategic goals. The company aims to achieve 100% sustainable raw material usage by 2030. In its 2022 sustainability report, Kaneka provided data showing a 30% reduction in CO2 emissions over the past five years, aligning with its goal to contribute positively to the environment and enhance its brand reputation.
| Strengths | Details |
|---|---|
| Diversified Product Portfolio | Sales Revenue: ¥756.8 billion ($5.4 billion); Life Science Division: 26% of sales |
| R&D Capabilities | Investment: ¥47.8 billion ($340 million); 6.3% of total revenue in 2022 |
| Global Presence | Manufacturing in 20 countries; International sales: 42% of total revenue in 2022 |
| Commitment to Sustainability | Goal: 100% sustainable raw materials by 2030; 30% reduction in CO2 emissions over five years |
Kaneka Corporation - SWOT Analysis: Weaknesses
Kaneka Corporation faces several weaknesses that could impact its overall market position and profitability. Understanding these vulnerabilities is crucial for stakeholders analyzing the company's long-term viability.
High Dependency on Certain Geographical Markets
Kaneka Corporation's revenue is heavily reliant on specific geographic regions, particularly Japan and Asia. In the fiscal year 2022, approximately 60% of its total sales were generated from the Asia-Pacific region. This dependency exposes the company to regional economic fluctuations and geopolitical tensions, which could adversely affect sales.
Vulnerability to Fluctuations in Raw Material Prices
The company operates in industries that are sensitive to changes in raw material costs, such as chemicals and resins. For instance, Kaneka experienced a 30% increase in the cost of key raw materials in 2022 compared to the previous year. This rise in costs can squeeze profit margins, as it may be challenging to pass these increases onto customers without compromising competitiveness.
Limited Brand Recognition Compared to Larger Market Players
Despite its technological capabilities, Kaneka struggles with brand recognition when compared to major competitors like BASF and DuPont. A 2022 market study indicated that Kaneka held only a 2% share of the global specialty chemical market, significantly lower than the 16% held by BASF. This lack of recognition can limit its ability to attract new customers and expand into new markets.
Complex Organizational Structure that May Slow Decision-Making
Kaneka's organizational structure comprises multiple divisions and subsidiaries, which may lead to slow decision-making processes. In 2023, internal surveys revealed that over 40% of employees felt that the complexity of the structure hindered rapid responses to market changes. This delay in action can be detrimental to the company in fast-paced industries.
| Weakness | Details | Impact |
|---|---|---|
| Geographical Dependency | 60% of sales from Asia-Pacific | Exposed to regional economic shifts |
| Raw Material Cost Fluctuations | 30% increase in raw material costs in 2022 | Pressure on profit margins |
| Brand Recognition | 2% market share in specialty chemicals | Limited customer attraction |
| Organizational Complexity | 40% of employees report slow decision-making | Hindered market response |
Kaneka Corporation - SWOT Analysis: Opportunities
Kaneka Corporation stands at the forefront of various market opportunities that align with global trends and consumer demands. By leveraging these opportunities, Kaneka can enhance its competitive position and drive growth across its various business segments.
Expansion into emerging markets with growing demand for advanced materials
The Asia-Pacific region is anticipated to witness significant growth in demand for advanced materials, with a projected CAGR of 6.3% from 2022 to 2028, according to industry reports. Kaneka can capitalize on this growth by expanding its operations in countries like India and Vietnam, where infrastructure development is accelerating.
For instance, the Indian construction materials market is expected to reach a value of $1 trillion by 2025, driven by increased urbanization and government initiatives. Kaneka's advanced polymers and high-performance materials can find substantial applications in this market.
Increasing demand for sustainable and bio-based products
As consumers increasingly prioritize sustainability, the demand for bio-based products is on the rise. The global bio-based materials market is expected to reach $5.5 billion by 2023, growing at a CAGR of 12.5% from 2018 to 2023. Kaneka’s expertise in sustainable materials positions it well within this market.
In particular, Kaneka's bioplastics and biodegradable products could fulfill the needs of environmentally conscious consumers and businesses. The global bioplastics market size was valued at approximately $6.8 billion in 2021 and is projected to grow significantly, creating opportunities for Kaneka to expand its product portfolio.
Opportunities for strategic partnerships and collaborations in tech development
Strategic partnerships can significantly enhance Kaneka's innovation capabilities. Collaborations with technology firms could lead to breakthroughs in product development. For example, partnering with companies in the semiconductor industry, which is projected to reach $1 trillion by 2030, could open up new avenues for Kaneka’s advanced materials in electronic applications.
Moreover, Kaneka has previously worked with universities and research institutions for R&D, yielding innovative solutions in advanced materials and biomedicine. As innovation is a key driver in today's market, further alliances could enhance Kaneka’s technological advancements and market reach.
Potential for growth in the healthcare and energy sectors
The healthcare sector is another area ripe for growth, with the global healthcare market expected to reach $11.9 trillion by 2027, growing at a CAGR of 8.9%. Kaneka’s capabilities in medical technology and biopharmaceuticals position it advantageously to capture a share of this expanding market.
Additionally, the energy sector presents significant opportunities, particularly in renewable energy solutions. The global renewable energy market size was valued at about $928 billion in 2017 and is expected to grow at a CAGR of 8.4% through 2025. Kaneka’s investments in solar energy solutions could yield substantial returns, given the increasing focus on sustainable energy sources.
| Industry | Market Size 2023 | CAGR (2022-2028) |
|---|---|---|
| Advanced Materials (Asia-Pacific) | $1 trillion | 6.3% |
| Bio-based Materials | $5.5 billion | 12.5% |
| Bioplastics | $6.8 billion | Varies |
| Healthcare Market | $11.9 trillion | 8.9% |
| Renewable Energy Market | $928 billion | 8.4% |
| Semiconductor Market | $1 trillion | Varies |
Kaneka Corporation - SWOT Analysis: Threats
Kaneka Corporation faces several threats that could impact its market position and financial performance.
Intense Competition from Both Local and International Companies
The chemical and materials industry is characterized by fierce competition. Companies such as BASF, Dow Chemical, and Mitsubishi Chemical pose significant challenges. In 2022, BASF reported sales of approximately €78.6 billion, while Dow Chemical's revenue for the same period was around $55 billion. This level of competition forces Kaneka to continually innovate and reduce prices to maintain market share.
Rapid Technological Advancements Requiring Continuous Adaptation
The industry is undergoing rapid technological changes, particularly in sustainable materials and advanced manufacturing processes. According to a report by McKinsey, investments in digital technologies in the manufacturing sector are expected to exceed $1.5 trillion globally by 2024. This necessitates substantial capital investment from companies like Kaneka to keep up with technological innovations, which can strain financial resources.
Economic Instability Affecting Global Trade Conditions
The global economy has seen fluctuations, with the IMF projecting global growth to slow to 3.0% in 2023. Economic instability can lead to decreased demand for Kaneka's products, particularly in key markets such as Europe and North America, which accounted for approximately 50% of Kaneka's total sales in 2022. Trade tensions, especially between the U.S. and China, further exacerbate these challenges, impacting supply chains and cost structures.
Stringent Environmental Regulations Impacting Manufacturing Processes
Environmental regulations are becoming increasingly stringent. In Japan, for instance, regulations related to chemical manufacturing have tightened, requiring compliance with the Chemical Substances Control Law (CSCL). Companies are investing heavily to meet compliance costs, with estimates suggesting that compliance costs can exceed 10% of total operational expenditures. Kaneka must allocate resources to adapt its processes to meet these regulations, affecting profitability.
| Threat | Impact on Kaneka | Quantifiable Data |
|---|---|---|
| Intense Competition | Pressure on pricing and profitability | BASF sales: €78.6 billion, Dow Chemical sales: $55 billion |
| Technological Advancements | Need for investment in new technologies | Global investment in digital tech: $1.5 trillion by 2024 |
| Economic Instability | Decreased demand and market volatility | IMF global growth projection: 3.0% in 2023 |
| Environmental Regulations | Increased compliance costs | Compliance costs can exceed 10% of operational expenditures |
In sum, Kaneka Corporation stands at a pivotal juncture where its strong R&D capabilities and commitment to sustainability offer promising opportunities, yet the company must navigate significant challenges, including intense competition and the complexities of market dependencies, to solidify its position in an evolving landscape.
Disclaimer
All information, articles, and product details provided on this website are for general informational and educational purposes only. We do not claim any ownership over, nor do we intend to infringe upon, any trademarks, copyrights, logos, brand names, or other intellectual property mentioned or depicted on this site. Such intellectual property remains the property of its respective owners, and any references here are made solely for identification or informational purposes, without implying any affiliation, endorsement, or partnership.
We make no representations or warranties, express or implied, regarding the accuracy, completeness, or suitability of any content or products presented. Nothing on this website should be construed as legal, tax, investment, financial, medical, or other professional advice. In addition, no part of this site—including articles or product references—constitutes a solicitation, recommendation, endorsement, advertisement, or offer to buy or sell any securities, franchises, or other financial instruments, particularly in jurisdictions where such activity would be unlawful.
All content is of a general nature and may not address the specific circumstances of any individual or entity. It is not a substitute for professional advice or services. Any actions you take based on the information provided here are strictly at your own risk. You accept full responsibility for any decisions or outcomes arising from your use of this website and agree to release us from any liability in connection with your use of, or reliance upon, the content or products found herein.