
|
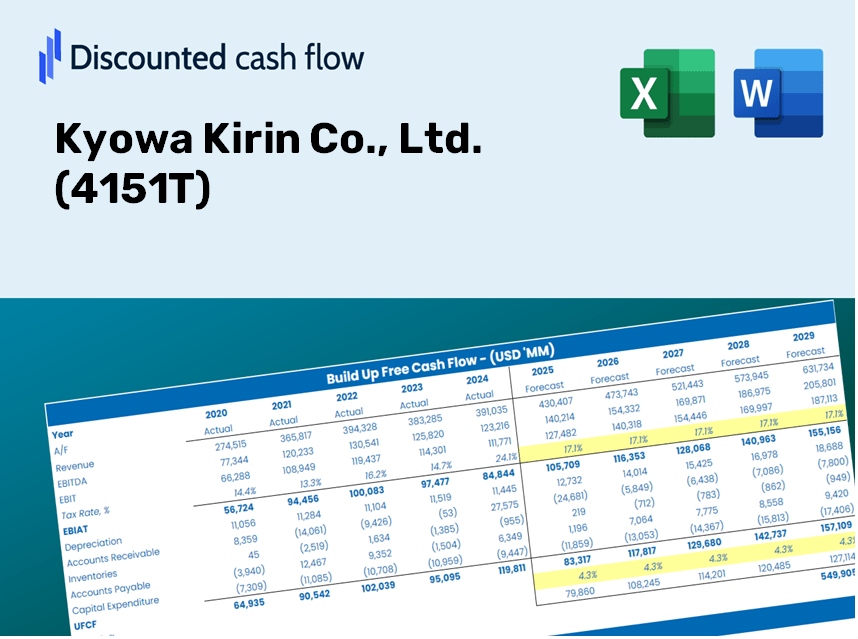
Kyowa Kirin Co., Ltd. (4151.T) DCF Valuation |
Fully Editable: Tailor To Your Needs In Excel Or Sheets
Professional Design: Trusted, Industry-Standard Templates
Investor-Approved Valuation Models
MAC/PC Compatible, Fully Unlocked
No Expertise Is Needed; Easy To Follow
Kyowa Kirin Co., Ltd. (4151.T) Bundle
Optimize your time and improve precision with our [4151T] DCF Calculator! Utilizing actual data from Kyowa Kirin Co., Ltd. and customizable assumptions, this tool empowers you to forecast, analyze, and evaluate [Company] just like a seasoned investor.
Discounted Cash Flow (DCF) - (USD MM)
| Year | AY1 2020 |
AY2 2021 |
AY3 2022 |
AY4 2023 |
AY5 2024 |
FY1 2025 |
FY2 2026 |
FY3 2027 |
FY4 2028 |
FY5 2029 |
|---|---|---|---|---|---|---|---|---|---|---|
| Revenue | 318,352.0 | 352,246.0 | 398,371.0 | 442,233.0 | 495,558.0 | 553,550.3 | 618,329.1 | 690,688.7 | 771,516.0 | 861,802.1 |
| Revenue Growth, % | 0 | 10.65 | 13.09 | 11.01 | 12.06 | 11.7 | 11.7 | 11.7 | 11.7 | 11.7 |
| EBITDA | 73,028.0 | 75,218.0 | 82,814.0 | 118,532.0 | 105,404.0 | 125,273.1 | 139,933.1 | 156,308.6 | 174,600.6 | 195,033.1 |
| EBITDA, % | 22.94 | 21.35 | 20.79 | 26.8 | 21.27 | 22.63 | 22.63 | 22.63 | 22.63 | 22.63 |
| Depreciation | 20,466.0 | 19,498.0 | 18,476.0 | 21,096.0 | 24,780.0 | 29,197.3 | 32,614.0 | 36,430.7 | 40,693.9 | 45,456.1 |
| Depreciation, % | 6.43 | 5.54 | 4.64 | 4.77 | 5 | 5.27 | 5.27 | 5.27 | 5.27 | 5.27 |
| EBIT | 52,562.0 | 55,720.0 | 64,338.0 | 97,436.0 | 80,624.0 | 96,075.8 | 107,319.0 | 119,878.0 | 133,906.6 | 149,576.9 |
| EBIT, % | 16.51 | 15.82 | 16.15 | 22.03 | 16.27 | 17.36 | 17.36 | 17.36 | 17.36 | 17.36 |
| Total Cash | 287,655.0 | 336,518.0 | 339,720.0 | 405,006.0 | 244,681.0 | 456,265.7 | 509,659.8 | 569,302.4 | 635,924.6 | 710,343.2 |
| Total Cash, percent | .0 | .0 | .0 | .0 | .0 | .0 | .0 | .0 | .0 | .0 |
| Account Receivables | 92,287.0 | 104,275.0 | 111,746.0 | 119,082.0 | 157,015.0 | 160,811.4 | 179,630.2 | 200,651.3 | 224,132.4 | 250,361.3 |
| Account Receivables, % | 28.99 | 29.6 | 28.05 | 26.93 | 31.68 | 29.05 | 29.05 | 29.05 | 29.05 | 29.05 |
| Inventories | 51,281.0 | 64,089.0 | 70,675.0 | 71,363.0 | 72,933.0 | 91,776.4 | 102,516.5 | 114,513.4 | 127,914.2 | 142,883.3 |
| Inventories, % | 16.11 | 18.19 | 17.74 | 16.14 | 14.72 | 16.58 | 16.58 | 16.58 | 16.58 | 16.58 |
| Accounts Payable | 54,867.0 | 64,652.0 | 7,903.0 | 92,983.0 | 121,063.0 | 91,920.5 | 102,677.5 | 114,693.2 | 128,115.1 | 143,107.7 |
| Accounts Payable, % | 17.23 | 18.35 | 1.98 | 21.03 | 24.43 | 16.61 | 16.61 | 16.61 | 16.61 | 16.61 |
| Capital Expenditure | -35,227.0 | -19,766.0 | -28,666.0 | -32,852.0 | -26,037.0 | -40,470.5 | -45,206.5 | -50,496.8 | -56,406.1 | -63,007.0 |
| Capital Expenditure, % | -11.07 | -5.61 | -7.2 | -7.43 | -5.25 | -7.31 | -7.31 | -7.31 | -7.31 | -7.31 |
| Tax Rate, % | 28.26 | 28.26 | 28.26 | 28.26 | 28.26 | 28.26 | 28.26 | 28.26 | 28.26 | 28.26 |
| EBITAT | 47,296.0 | 48,572.4 | 51,008.2 | 81,346.6 | 57,840.4 | 79,101.9 | 88,358.7 | 98,698.8 | 110,249.0 | 123,150.8 |
| Depreciation | ||||||||||
| Changes in Account Receivables | ||||||||||
| Changes in Inventories | ||||||||||
| Changes in Accounts Payable | ||||||||||
| Capital Expenditure | ||||||||||
| UFCF | -56,166.0 | 33,293.4 | -29,987.8 | 146,646.6 | 45,160.4 | 16,046.4 | 56,964.2 | 63,630.4 | 71,076.8 | 79,394.5 |
| WACC, % | 4.63 | 4.63 | 4.63 | 4.63 | 4.62 | 4.63 | 4.63 | 4.63 | 4.63 | 4.63 |
| PV UFCF | ||||||||||
| SUM PV UFCF | 245,568.4 | |||||||||
| Long Term Growth Rate, % | 3.00 | |||||||||
| Free cash flow (T + 1) | 81,776 | |||||||||
| Terminal Value | 5,026,262 | |||||||||
| Present Terminal Value | 4,008,913 | |||||||||
| Enterprise Value | 4,254,481 | |||||||||
| Net Debt | -223,006 | |||||||||
| Equity Value | 4,477,487 | |||||||||
| Diluted Shares Outstanding, MM | 530 | |||||||||
| Equity Value Per Share | 8,455.16 |
What You Will Receive
- Genuine Kyowa Kirin Data: Preloaded financials – from revenue to EBIT – based on actual and projected figures.
- Complete Customization: Modify essential parameters (yellow cells) such as WACC, growth %, and tax rates.
- Instant Valuation Adjustments: Automatic recalculations to assess the impact of changes on Kyowa Kirin’s fair value.
- Flexible Excel Template: Designed for quick modifications, scenario analysis, and comprehensive projections.
- Efficient and Precise: Eliminate the need to construct models from the ground up while ensuring accuracy and adaptability.
Key Features
- 🔍 Real-Life Kyorin Financials: Pre-filled historical and projected data for Kyowa Kirin Co., Ltd. (4151T).
- ✏️ Fully Customizable Inputs: Modify all essential parameters (yellow cells) such as WACC, growth %, and tax rates.
- 📊 Professional DCF Valuation: Integrated formulas calculate the intrinsic value of Kyowa Kirin using the Discounted Cash Flow method.
- ⚡ Instant Results: Immediately visualize Kyowa Kirin’s valuation upon making adjustments.
- Scenario Analysis: Evaluate and compare outcomes for varying financial assumptions side-by-side.
How It Functions
- 1. Access the Template: Download and open the Excel file containing Kyowa Kirin Co., Ltd.’s (4151T) preloaded data.
- 2. Adjust Parameters: Modify essential inputs such as growth rates, WACC, and capital expenditures.
- 3. View Results Instantly: The DCF model automatically calculates the intrinsic value and NPV for you.
- 4. Evaluate Scenarios: Analyze various forecasts to assess different valuation possibilities.
- 5. Utilize with Assurance: Deliver professional valuation insights to back your decision-making.
Why Opt for This Calculator for Kyowa Kirin Co., Ltd. (4151T)?
- Precision: Utilizes authentic Kyowa Kirin financials to guarantee data integrity.
- Versatility: Built to allow users to easily test and adjust inputs as needed.
- Efficiency: Eliminate the complexities of constructing a DCF model from the ground up.
- Expert-Level: Crafted with the expertise and functionality expected at the CFO level.
- Intuitive: Simple to navigate, making it accessible for individuals without advanced financial modeling skills.
Who Can Benefit from Kyowa Kirin Co., Ltd. (4151T)?
- Investors: Make informed choices with a cutting-edge valuation tool tailored for pharmaceutical companies.
- Financial Analysts: Streamline your workflow with our customizable DCF model designed for biotech assessments.
- Consultants: Effortlessly modify the template for client briefings or analytical reports.
- Pharmaceutical Enthusiasts: Enhance your knowledge of valuation methodologies through practical, real-world applications.
- Educators and Students: Utilize it as a hands-on resource in courses focused on finance and healthcare sectors.
Contents of the Template
- Pre-Filled Data: Contains Kyowa Kirin’s historical financial data and projections.
- Discounted Cash Flow Model: An editable DCF valuation model featuring automatic calculations.
- Weighted Average Cost of Capital (WACC): A specialized sheet for calculating WACC using custom inputs.
- Key Financial Ratios: Evaluate Kyowa Kirin’s profitability, efficiency, and financial leverage.
- Customizable Inputs: Easily modify revenue growth rates, profit margins, and tax rates.
- Comprehensive Dashboard: Visualizations and tables that summarize critical valuation findings.
Disclaimer
All information, articles, and product details provided on this website are for general informational and educational purposes only. We do not claim any ownership over, nor do we intend to infringe upon, any trademarks, copyrights, logos, brand names, or other intellectual property mentioned or depicted on this site. Such intellectual property remains the property of its respective owners, and any references here are made solely for identification or informational purposes, without implying any affiliation, endorsement, or partnership.
We make no representations or warranties, express or implied, regarding the accuracy, completeness, or suitability of any content or products presented. Nothing on this website should be construed as legal, tax, investment, financial, medical, or other professional advice. In addition, no part of this site—including articles or product references—constitutes a solicitation, recommendation, endorsement, advertisement, or offer to buy or sell any securities, franchises, or other financial instruments, particularly in jurisdictions where such activity would be unlawful.
All content is of a general nature and may not address the specific circumstances of any individual or entity. It is not a substitute for professional advice or services. Any actions you take based on the information provided here are strictly at your own risk. You accept full responsibility for any decisions or outcomes arising from your use of this website and agree to release us from any liability in connection with your use of, or reliance upon, the content or products found herein.