
|
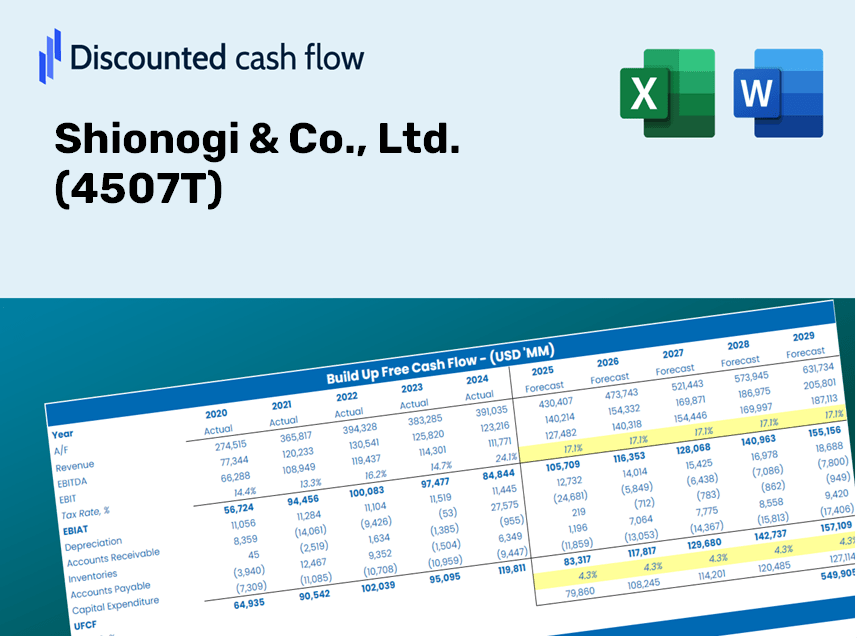
Shionogi & Co., Ltd. (4507.T) DCF Valuation |
Fully Editable: Tailor To Your Needs In Excel Or Sheets
Professional Design: Trusted, Industry-Standard Templates
Investor-Approved Valuation Models
MAC/PC Compatible, Fully Unlocked
No Expertise Is Needed; Easy To Follow
Shionogi & Co., Ltd. (4507.T) Bundle
Looking to assess Shionogi & Co., Ltd.'s intrinsic value? Our (4507T) DCF Calculator integrates real data with comprehensive customization features, enabling you to refine your forecasts and enhance your investment decisions.
Discounted Cash Flow (DCF) - (USD MM)
| Year | AY1 2021 |
AY2 2022 |
AY3 2023 |
AY4 2024 |
AY5 2025 |
FY1 2026 |
FY2 2027 |
FY3 2028 |
FY4 2029 |
FY5 2030 |
|---|---|---|---|---|---|---|---|---|---|---|
| Revenue | 297,177.0 | 335,138.0 | 426,684.0 | 435,081.0 | 438,268.0 | 485,152.0 | 537,051.4 | 594,502.9 | 658,100.2 | 728,500.9 |
| Revenue Growth, % | 0 | 12.77 | 27.32 | 1.97 | 0.73251 | 10.7 | 10.7 | 10.7 | 10.7 | 10.7 |
| EBITDA | 158,670.0 | 143,423.0 | 176,413.0 | 217,810.0 | 230,712.0 | 233,102.4 | 258,038.7 | 285,642.5 | 316,199.3 | 350,024.9 |
| EBITDA, % | 53.39 | 42.8 | 41.35 | 50.06 | 52.64 | 48.05 | 48.05 | 48.05 | 48.05 | 48.05 |
| Depreciation | 14,709.0 | 16,293.0 | 17,165.0 | 18,323.0 | 20,933.0 | 22,144.0 | 24,512.9 | 27,135.2 | 30,038.0 | 33,251.3 |
| Depreciation, % | 4.95 | 4.86 | 4.02 | 4.21 | 4.78 | 4.56 | 4.56 | 4.56 | 4.56 | 4.56 |
| EBIT | 143,961.0 | 127,130.0 | 159,248.0 | 199,487.0 | 209,779.0 | 210,958.4 | 233,525.8 | 258,507.3 | 286,161.3 | 316,773.6 |
| EBIT, % | 48.44 | 37.93 | 37.32 | 45.85 | 47.87 | 43.48 | 43.48 | 43.48 | 43.48 | 43.48 |
| Total Cash | 276,173.0 | 254,420.0 | 309,224.0 | 358,090.0 | 374,795.0 | 396,990.3 | 439,458.6 | 486,469.9 | 538,510.4 | 596,117.9 |
| Total Cash, percent | .0 | .0 | .0 | .0 | .0 | .0 | .0 | .0 | .0 | .0 |
| Account Receivables | 78,211.0 | 122,965.0 | 109,774.0 | 122,830.0 | 120,553.0 | 140,184.0 | 155,180.2 | 171,780.8 | 190,157.1 | 210,499.3 |
| Account Receivables, % | 26.32 | 36.69 | 25.73 | 28.23 | 27.51 | 28.89 | 28.89 | 28.89 | 28.89 | 28.89 |
| Inventories | 38,003.0 | 45,892.0 | 57,919.0 | 64,916.0 | 65,477.0 | 67,839.8 | 75,097.0 | 83,130.6 | 92,023.6 | 101,867.8 |
| Inventories, % | 12.79 | 13.69 | 13.57 | 14.92 | 14.94 | 13.98 | 13.98 | 13.98 | 13.98 | 13.98 |
| Accounts Payable | 9,902.0 | 16,372.0 | 14,005.0 | 14,808.0 | 13,579.0 | 17,466.7 | 19,335.2 | 21,403.6 | 23,693.3 | 26,227.9 |
| Accounts Payable, % | 3.33 | 4.89 | 3.28 | 3.4 | 3.1 | 3.6 | 3.6 | 3.6 | 3.6 | 3.6 |
| Capital Expenditure | -32,944.0 | -31,564.0 | -37,187.0 | -28,267.0 | -17,126.0 | -38,447.1 | -42,560.1 | -47,112.9 | -52,152.9 | -57,732.0 |
| Capital Expenditure, % | -11.09 | -9.42 | -8.72 | -6.5 | -3.91 | -7.92 | -7.92 | -7.92 | -7.92 | -7.92 |
| Tax Rate, % | 15.1 | 15.1 | 15.1 | 15.1 | 15.1 | 15.1 | 15.1 | 15.1 | 15.1 | 15.1 |
| EBITAT | 112,595.5 | 114,964.5 | 133,686.0 | 163,013.9 | 178,099.5 | 176,870.3 | 195,791.1 | 216,736.0 | 239,921.5 | 265,587.2 |
| Depreciation | ||||||||||
| Changes in Account Receivables | ||||||||||
| Changes in Inventories | ||||||||||
| Changes in Accounts Payable | ||||||||||
| Capital Expenditure | ||||||||||
| UFCF | -11,951.5 | 53,520.5 | 112,461.0 | 133,819.9 | 182,393.5 | 142,461.1 | 157,359.0 | 174,192.6 | 192,826.9 | 213,454.7 |
| WACC, % | 4.93 | 4.98 | 4.95 | 4.94 | 4.95 | 4.95 | 4.95 | 4.95 | 4.95 | 4.95 |
| PV UFCF | ||||||||||
| SUM PV UFCF | 755,897.7 | |||||||||
| Long Term Growth Rate, % | 2.00 | |||||||||
| Free cash flow (T + 1) | 217,724 | |||||||||
| Terminal Value | 7,381,962 | |||||||||
| Present Terminal Value | 5,797,916 | |||||||||
| Enterprise Value | 6,553,814 | |||||||||
| Net Debt | -352,913 | |||||||||
| Equity Value | 6,906,727 | |||||||||
| Diluted Shares Outstanding, MM | 851 | |||||||||
| Equity Value Per Share | 8,116.62 |
What You Will Gain
- Authentic Shionogi Data: Preloaded financials – from revenue to EBIT – derived from both actual and projected figures.
- Comprehensive Customization: Modify all key parameters (highlighted cells) such as WACC, growth %, and tax rates.
- Immediate Valuation Adjustments: Automatic recalculations to assess the effects of modifications on Shionogi's fair value.
- Flexible Excel Template: Designed for quick modifications, scenario analysis, and detailed forecasting.
- Efficient and Precise: Avoid the hassle of building models from the ground up while ensuring accuracy and adaptability.
Key Features
- 🔍 Real-Life {Shionogi & Co., Ltd.} Financials: Pre-filled historical and projected data for Shionogi & Co., Ltd. (4507T).
- ✏️ Fully Customizable Inputs: Adjust all critical parameters (yellow cells) such as WACC, growth %, and tax rates.
- 📊 Professional DCF Valuation: Integrated formulas calculate Shionogi’s intrinsic value using the Discounted Cash Flow method.
- ⚡ Instant Results: Visualize Shionogi’s valuation immediately after making adjustments.
- Scenario Analysis: Evaluate and compare outcomes for various financial assumptions side-by-side.
How It Functions
- 1. Access the Template: Download and open the Excel file containing Shionogi & Co., Ltd.'s preloaded data.
- 2. Modify Assumptions: Adjust key inputs such as growth rates, WACC, and capital expenditures.
- 3. Instantly View Results: The DCF model automatically computes intrinsic value and NPV.
- 4. Evaluate Scenarios: Explore various forecasts to assess different valuation results.
- 5. Present with Assurance: Share expert valuation insights to reinforce your strategic decisions.
Why Choose This Calculator for Shionogi & Co., Ltd. (4507T)?
- All-in-One Solution: Features DCF, WACC, and financial ratio analyses tailored for Shionogi & Co., Ltd. (4507T).
- Adaptable Inputs: Modify yellow-highlighted cells to explore different financial scenarios.
- In-Depth Analysis: Automatically computes Shionogi's intrinsic value and Net Present Value.
- Preloaded Metrics: Historical and projected data provide reliable starting points for analysis.
- Expert-Level Tool: Perfect for financial analysts, investors, and business consultants focused on Shionogi & Co., Ltd. (4507T).
Who Can Benefit from This Product?
- Finance Students: Master valuation methods and apply them using real-world data.
- Academics: Integrate industry-standard models into your research or teaching materials.
- Investors: Validate your investment strategies and evaluate valuation results for Shionogi & Co., Ltd. (4507T).
- Analysts: Enhance your analysis process with a customizable, ready-to-use DCF model.
- Entrepreneurs: Understand how major public companies like Shionogi & Co., Ltd. (4507T) are assessed in the market.
Contents of the Template
- Pre-Filled Data: Contains Shionogi & Co., Ltd.'s historical financial information and forecasts.
- Discounted Cash Flow Model: An editable DCF valuation model with automatic calculation features.
- Weighted Average Cost of Capital (WACC): A separate sheet for WACC calculation based on user-defined inputs.
- Key Financial Ratios: Evaluate Shionogi's profitability, efficiency, and financial leverage.
- Customizable Inputs: Easily adjust revenue growth, profit margins, and tax rates.
- Clear Dashboard: Visual representations and tables that summarize essential valuation outcomes.
Disclaimer
All information, articles, and product details provided on this website are for general informational and educational purposes only. We do not claim any ownership over, nor do we intend to infringe upon, any trademarks, copyrights, logos, brand names, or other intellectual property mentioned or depicted on this site. Such intellectual property remains the property of its respective owners, and any references here are made solely for identification or informational purposes, without implying any affiliation, endorsement, or partnership.
We make no representations or warranties, express or implied, regarding the accuracy, completeness, or suitability of any content or products presented. Nothing on this website should be construed as legal, tax, investment, financial, medical, or other professional advice. In addition, no part of this site—including articles or product references—constitutes a solicitation, recommendation, endorsement, advertisement, or offer to buy or sell any securities, franchises, or other financial instruments, particularly in jurisdictions where such activity would be unlawful.
All content is of a general nature and may not address the specific circumstances of any individual or entity. It is not a substitute for professional advice or services. Any actions you take based on the information provided here are strictly at your own risk. You accept full responsibility for any decisions or outcomes arising from your use of this website and agree to release us from any liability in connection with your use of, or reliance upon, the content or products found herein.