
|
Oriental Land Co., Ltd. (4661.T): BCG Matrix [Apr-2026 Updated] |
Fully Editable: Tailor To Your Needs In Excel Or Sheets
Professional Design: Trusted, Industry-Standard Templates
Investor-Approved Valuation Models
MAC/PC Compatible, Fully Unlocked
No Expertise Is Needed; Easy To Follow
Oriental Land Co., Ltd. (4661.T) Bundle
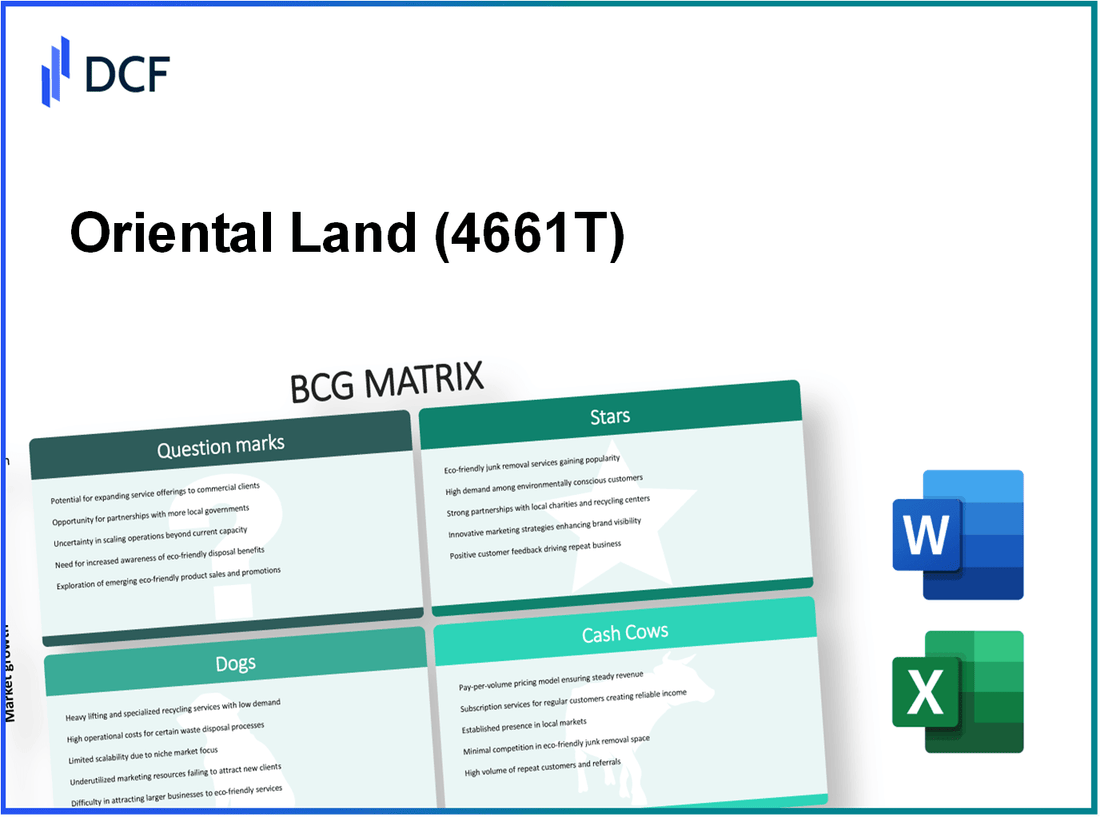
Oriental Land's portfolio is powered by high-margin Stars - Fantasy Springs, premium hotels and fast-growing digital upsells - that are fueling strong guest spending and justify heavy reinvestment, while mature Cash Cows like Tokyo Disneyland, in-park merchandise and F&B reliably fund that growth; the company must now decide how aggressively to bankroll Question Marks (the Japan Disney Cruise, Tomorrowland redevelopment and nascent international consulting) that could reshape future scale, and whether to streamline or shed low-return Dogs (monorail, Ikspiari, corporate programs) that tie up capital and management focus.
Oriental Land Co., Ltd. (4661.T) - BCG Matrix Analysis: Stars
Fantasy Springs expansion drives massive growth. The newly opened Fantasy Springs area at Tokyo DisneySea has propelled segment revenue growth to over 12% annually as of late 2025. The 320 billion yen capital investment-the largest in park history-has increased resort capacity materially and lifted average guest spending to approximately 16,500 yen per person. The segment holds a dominant 45% share of the domestic theme park market and achieves operating margins exceeding 30%. High ongoing capital expenditure continues as management optimizes guest flow and integrates advanced ride technologies to sustain growth and experience quality.
Luxury hotel segment achieves record performance. The Disney Hotels portfolio, anchored by the new Fantasy Springs Hotel, operates at an exceptional occupancy rate of ~98% and contributes roughly 15% of total company revenue. The portfolio commands a premium ADR (average daily rate) exceeding 80,000 yen and benefits from a 20% year-over-year increase in international bookings. Operating margins for the hotel division have reached approximately 35% due to strong demand, premium pricing, and efficient dynamic pricing strategies. Capital intensity remains high but ROI outperforms standard lodging competitors.
Digital services and premier access surge. The Disney Premier Access digital platform has seen adoption rise by 25% in the most recent year, contributing materially to a 16% increase in per-capita guest spending in fiscal 2025. With negligible marginal costs, profit margins on digital up-sells are estimated above 80%. The digital segment now accounts for nearly 10% of total park-related income and leverages the high market share of the physical parks to scale rapidly within the mobile app ecosystem.
Key star-unit performance indicators and comparative metrics are summarized below.
| Business Unit | CapEx (JPY) | Revenue Growth (YoY) | Market Share (Domestic) | Average Spend / ADR | Operating Margin | Contribution to Company Revenue | Segment Share of Park Income |
|---|---|---|---|---|---|---|---|
| Fantasy Springs (Theme Park) | 320,000,000,000 | 12%+ | 45% | 16,500 yen per guest | >30% | - (primary park revenue driver) | Estimated 55-60% of park revenue uplift |
| Disney Hotels (Luxury) | Significant ongoing investment | High; international bookings +20% YoY | Premium segment leadership (domestic luxury) | ADR >80,000 yen | ~35% | ~15% of total company revenue | Direct lodging revenue; strong cross-sell to parks |
| Disney Premier Access (Digital) | Low incremental CapEx (platform investment) | Adoption +25% (high growth) | Leverages park market share | Contributes to +16% per-capita spend | >80% (marginal profit) | ~10% of park-related income | Rapidly scalable digital revenue stream |
Strategic implications and operational priorities for these star units:
- Maintain high reinvestment in Fantasy Springs to protect growth trajectory and guest satisfaction while managing CapEx phasing and cash flow.
- Leverage premium pricing and occupancy in hotels to maximize RevPAR, while expanding international marketing to sustain +20% international booking momentum.
- Scale digital Premier Access with product enhancements and cross-sell bundling to capture >10% park income and sustain >80% margins.
- Optimize guest flow, yield management, and inventory controls across parks and hotels to preserve operating margins above 30% for parks and ~35% for hotels.
- Monitor competitive response domestically and adjust promotional cadence to defend 45% domestic park market share.
Oriental Land Co., Ltd. (4661.T) - BCG Matrix Analysis: Cash Cows
Cash Cows
Tokyo Disneyland maintains dominant market leadership. The original Tokyo Disneyland park remains the primary cash generator for Oriental Land Co., Ltd., reporting an estimated operating margin of approximately 28% for the park-level operations in the latest full-year consolidated reporting period. Tokyo Disneyland captures roughly 50% of the Japanese theme park industry revenue by our estimate (industry revenue ~¥1.2 trillion; Tokyo Disneyland share ~¥600 billion). Annual attendance for Tokyo Disneyland alone consistently exceeds 15 million visitors (15.2-15.8 million range historically), producing predictable cash flow and high return on invested capital due to controlled maintenance costs versus premium average ticket pricing (average ticket yield per guest for Tokyo parks ~¥9,000-¥11,000). The mature asset requires limited incremental capital expenditure beyond routine refurbishment cycles, enabling surplus cash to fund major strategic investments, including the ¥330 billion cruise ship venture and other high-growth initiatives.
| Metric | Value |
|---|---|
| Estimated park operating margin | 28% |
| Share of Japan theme park revenue | ~50% (¥600bn of ¥1.2tn) |
| Annual attendance (Tokyo Disneyland) | 15.2-15.8 million visitors |
| Average ticket yield (parks) | ¥9,000-¥11,000 per guest |
| Allocated funding to cruise project from cash cows | ¥330 billion |
| Estimated maintenance-to-revenue ratio | ~7-9% |
In-park merchandise sales deliver consistent returns. The retail division across the resort contributes a stable ~30% to Oriental Land's consolidated revenue (retail revenue estimate: ~¥180-¥220 billion annually depending on park visitation cycles). The merchandise segment holds a dominant domestic market share for exclusive Disney-branded consumer goods-products largely unavailable via alternative domestic channels-supporting resilient pricing power and high-volume turnover. Profit margins for merchandise are robust at around 25% gross margin and an estimated operating margin near 15% after retail operating costs. Revenue per guest for merchandise has stabilized at approximately ¥5,000, and unit economics show low incremental capital requirements for existing retail locations, yielding elevated free cash flow conversion.
- Merchandise contribution to consolidated revenue: ~30%
- Revenue per guest (merchandise): ~¥5,000
- Gross margin (merchandise): ~25%
- Operating margin (retail): ~15%
- Annual merchandise revenue estimate: ¥180-¥220 billion
| Merchandise KPI | Value |
|---|---|
| Revenue per guest | ¥5,000 |
| Annual revenue (estimate) | ¥180-¥220 billion |
| Gross margin | ~25% |
| Operating margin | ~15% |
| Capital expenditure requirement | Low (routine store refits) |
Food and beverage operations provide stability. Dining, catering, and refreshment services across Tokyo Disney Resort account for roughly 20% of Oriental Land's total annual revenue (estimated F&B revenue: ¥120-¥140 billion). This segment shows low top-line growth consistent with a mature consumer base but secures a high share of guest per-visit discretionary spend inside the resort perimeter. Operating margins for F&B are maintained around 20% through measures such as menu engineering, supply chain optimization, centralized purchasing, and increased deployment of automated service kiosks and point-of-sale efficiency. Average guest F&B spend is consistent at approximately ¥3,500 per visit. CapEx requirements are modest-primarily periodic kitchen equipment renewal and outlet refreshes-so F&B contributes steady, low-variance cash flow supporting corporate liquidity and investment capacity.
| F&B Metric | Value |
|---|---|
| Share of consolidated revenue | ~20% |
| Estimated annual revenue | ¥120-¥140 billion |
| Average spend per guest | ¥3,500 |
| Operating margin | ~20% |
| Typical CapEx | Routine equipment and outlet refurbishments |
- F&B contribution to cash flow: Stable, predictable; low reinvestment needs
- Primary levers: menu mix optimization, automation, centralized procurement
- Role in portfolio: funding source for growth investments and one-off strategic projects
Oriental Land Co., Ltd. (4661.T) - BCG Matrix Analysis: Question Marks
Dogs - Question Marks
The Disney Cruise Line Japan venture is currently a classic Question Mark: Oriental Land Co. has committed 330 billion yen to establish a Japan-based Disney Cruise operation that at present holds 0% market share. Projected annual revenue is 100 billion yen once fully operational by early 2029, implying a projected revenue-to-capex payback ratio of ~0.30x per year (100bn/330bn) excluding operating margins, financing costs and depreciation. The project is in a pre-revenue phase with negative ROI as capital is sunk into ship construction, port infrastructure and marketing through 2027-2029. Success requires capturing a niche of high-spending domestic and international tourists; sensitivity analysis indicates break-even occupancy and yield thresholds likely exceed 60% cabin occupancy at premium average daily rates. The Asian luxury cruise market growth is estimated at roughly 8-10% CAGR in premium segments, but the competitive and regulatory barriers, plus long lead times for vessel delivery, raise structural risk.
| Metric | Committed CapEx (¥) | Projected Annual Revenue (¥) | Current Market Share | Expected Operational Date | Current ROI |
|---|---|---|---|---|---|
| Disney Cruise Line Japan | 330,000,000,000 | 100,000,000,000 | 0% | Early 2029 | Negative (pre-launch) |
The Tomorrowland redevelopment, including a 56 billion yen reconstruction of Space Mountain and surrounding areas, is another Question Mark: zero current revenue contribution during construction with an estimated 5% uplift in overall resort attendance upon completion targeted for 2027. If total resort revenue is approximated at X (use company reported resort revenues; e.g., if resort revenue were ~300 billion yen per year), a 5% attendance-driven revenue uplift could imply incremental revenue near 15 billion yen annually post-completion. Short-term impacts include construction capex consumption, temporary attraction closures and opportunity cost of lost footfall in the zone. The strategic aim is to arrest attendance decline and differentiate versus regional competitors by deploying advanced ride systems and immersive storytelling; payback depends on sustained attendance gains, per-capita spend increases and incremental ancillary revenue (F&B, merchandise, VIP experiences).
| Metric | Project CapEx (¥) | Projected Attendance Uplift | Estimated Incremental Revenue (¥/yr) | Expected Completion |
|---|---|---|---|---|
| Tomorrowland / Space Mountain Redevelopment | 56,000,000,000 | +5% resort attendance | ~15,000,000,000 (example based on 300bn base) | 2027 |
International consulting and brand licensing expansion represents a low-capex, high-uncertainty Question Mark: current contribution is under 1% of total revenue, while the global market for theme park consulting and operational licensing is growing around 7% annually. Scaling internationally faces constraints in brand rights, IP governance, local partnership negotiation and potential cannibalization or dilution risks. If pilot engagements scale to capture even 2-3% of regional consulting markets, incremental revenue potential could be meaningful relative to its current small base, but timeline and margin profiles are uncertain. This unit remains experimental with high upside if replicable operational excellence can be exported.
| Metric | Current Revenue Contribution | Market Growth | Market Share Outside Japan | CapEx Requirement |
|---|---|---|---|---|
| International Consulting & Licensing | <1% total revenue | ~7% CAGR (global theme park expertise market) | Very low | Low to moderate (primarily personnel and legal) |
Collective risk and sensitivity factors for these Question Marks:
- High capital intensity and long payback periods (Disney Cruise: 330bn yen; Tomorrowland: 56bn yen).
- Pre-revenue or temporary zero-revenue phases producing negative ROI until operations commence.
- Market growth uncertainty and competitive pressures in Asian luxury cruise and regional theme-park renewals.
- Execution risk: shipbuilding delays, regulatory approvals, construction overruns and IP/licensing negotiation failures.
- Potential upside: 100bn yen annual cruise revenue, ~15bn yen incremental park revenue post-redevelopment, scalable consulting revenue if partnerships succeed.
Oriental Land Co., Ltd. (4661.T) - BCG Matrix Analysis: Dogs
Question Marks - evaluated here as lower-growth, lower-share peripheral businesses within Oriental Land's portfolio - include the Disney Resort Line monorail, the Ikspiari retail complex, and third-party corporate program services. Each unit shows constrained growth prospects, limited market share expansion potential, and comparatively thin margins versus core theme park operations. The following table summarizes key quantitative metrics for these units based on consolidated revenue attribution, recent annual growth trends, operating margin indicators, and strategic capital posture.
| Business Unit | % of Consolidated Revenue (approx.) | Annual Growth Rate (recent) | Operating Margin (approx.) | Relative Market Share / Position | CapEx Stance | Notes |
|---|---|---|---|---|---|---|
| Disney Resort Line (Monorail) | ≈ 2.5% | ≈ 0.5% (under 1% pa) | ≈ 5%-8% (thin) | Low in public transit / resort transport niche | Safety & renewal only; no expansionary CapEx | Regulated fares; high fixed maintenance & depreciation |
| Ikspiari (Retail Mall) | ≈ 5.0% | ≈ 0% (plateaued) | <10% (often below 10%) | Low share vs. Chiba prefecture retail market | Selective tenant investment; no major redevelopment | Pressure from e-commerce; experiential competition |
| Third‑party Corporate Programs | < 2.0% | ≈ -2% to -5% (steady decline) | ≈ 4%-7% (lower than DTC sales) | Low share in corporate incentive market | Reduced marketing & limited program investment | Shift to individualized benefits; lower demand for bulk packages |
Disney Resort Line faces stagnant passenger demand growth, limited fare flexibility due to regulatory and concession constraints, and a cost structure dominated by fixed maintenance, depot and rolling stock depreciation. Contribution to consolidated revenue is under 3 percent, annual ridership-driven revenue growth is under 1 percent, and capital budgets are restricted to safety-related renewals rather than capacity or service expansion.
- Revenue contribution: ~2.5% of consolidated revenue
- Growth: <1% per year
- Margins: estimated 5%-8% due to high fixed costs
- CapEx: replacement and safety only; no expansion
Ikspiari retail management, adjacent to the parks, generates roughly 5 percent of group revenue but lacks the discretionary spending capture of park guests necessary for high-margin retail performance. The unit's annual growth has plateaued near zero as consumers migrate to online and experience-first spending, and operating margins frequently fall below 10 percent. Competitive pressure from larger regional malls and lifestyle complexes in Chiba erodes market share, limiting strategic upside without major reinvention or unique experiential offerings.
- Revenue contribution: ~5% of consolidated revenue
- Growth: ≈ 0% (flat)
- Margins: often <10%
- Competitive position: low share in regional retail market
The third‑party corporate program services segment has declined to under 2 percent of consolidated revenue as corporate demand for bulk outing packages wanes. Market growth in the corporate incentive and group-outing channel is negative, as employers favor personalized benefits and flexible reward models. Oriental Land has reallocated marketing spend away from this unit, maintaining it primarily for legacy relationships rather than as a growth engine; margins are lower than direct-to-consumer ticketing and the unit holds limited relative share in the broader corporate market.
- Revenue contribution: <2% of consolidated revenue
- Growth: negative (estimated -2% to -5% annually)
- Margins: ~4%-7%
- Strategic posture: de-prioritized marketing; relationship maintenance
Disclaimer
All information, articles, and product details provided on this website are for general informational and educational purposes only. We do not claim any ownership over, nor do we intend to infringe upon, any trademarks, copyrights, logos, brand names, or other intellectual property mentioned or depicted on this site. Such intellectual property remains the property of its respective owners, and any references here are made solely for identification or informational purposes, without implying any affiliation, endorsement, or partnership.
We make no representations or warranties, express or implied, regarding the accuracy, completeness, or suitability of any content or products presented. Nothing on this website should be construed as legal, tax, investment, financial, medical, or other professional advice. In addition, no part of this site—including articles or product references—constitutes a solicitation, recommendation, endorsement, advertisement, or offer to buy or sell any securities, franchises, or other financial instruments, particularly in jurisdictions where such activity would be unlawful.
All content is of a general nature and may not address the specific circumstances of any individual or entity. It is not a substitute for professional advice or services. Any actions you take based on the information provided here are strictly at your own risk. You accept full responsibility for any decisions or outcomes arising from your use of this website and agree to release us from any liability in connection with your use of, or reliance upon, the content or products found herein.