
|
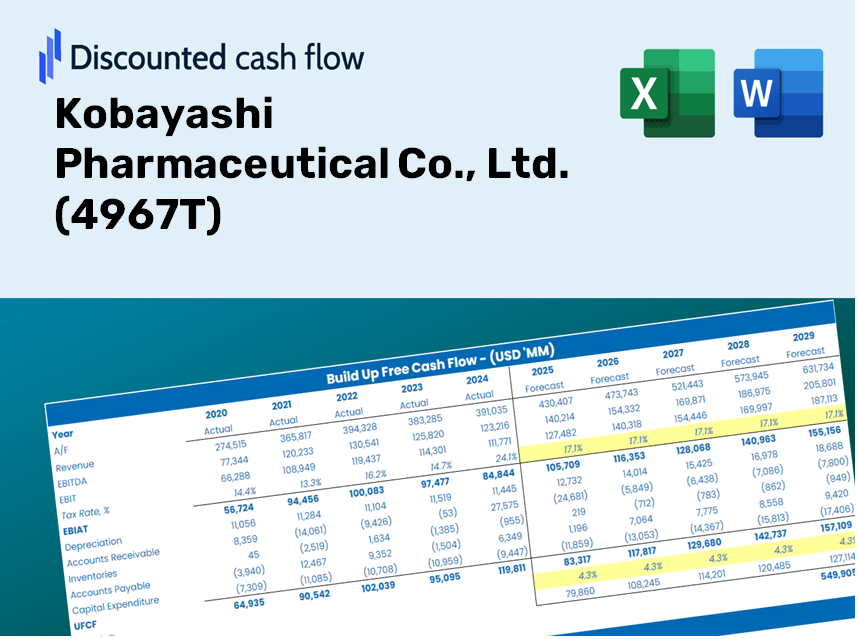
Kobayashi Pharmaceutical Co., Ltd. (4967.T) DCF Valuation |
Fully Editable: Tailor To Your Needs In Excel Or Sheets
Professional Design: Trusted, Industry-Standard Templates
Investor-Approved Valuation Models
MAC/PC Compatible, Fully Unlocked
No Expertise Is Needed; Easy To Follow
Kobayashi Pharmaceutical Co., Ltd. (4967.T) Bundle
Explore the financial outlook of Kobayashi Pharmaceutical Co., Ltd. (4967T) with our user-friendly DCF Calculator! Enter your projections for growth, margins, and expenses to calculate the intrinsic value of Kobayashi Pharmaceutical Co., Ltd. (4967T) and enhance your investment strategy.
What You Will Receive
- Editable Forecast Inputs: Seamlessly adjust assumptions (growth %, margins, WACC) to craft various scenarios.
- Real-World Data: Kobayashi Pharmaceutical’s financial data pre-loaded to kickstart your analysis.
- Automatic DCF Outputs: The template computes Net Present Value (NPV) and intrinsic value for you.
- Customizable and Professional: A sophisticated Excel model tailored to meet your valuation requirements.
- Designed for Analysts and Investors: Perfect for testing projections, verifying strategies, and enhancing efficiency.
Key Features
- Customizable Financial Parameters: Adjust essential inputs such as revenue growth, EBITDA margin, and capital expenditures.
- Instant DCF Valuation: Computes intrinsic value, NPV, and various outputs in real-time.
- High-Precision Accuracy: Leverages Kobayashi Pharmaceutical's actual financial data for credible valuation results.
- Effortless Scenario Analysis: Easily evaluate different assumptions and analyze the resulting outcomes.
- Efficiency Booster: Streamline the process by eliminating the need to create complex valuation models from the ground up.
How It Works
- 1. Access the Template: Download and open the Excel file containing Kobayashi Pharmaceutical Co., Ltd.’s preloaded data.
- 2. Adjust Assumptions: Modify essential inputs such as growth projections, WACC, and capital expenditures.
- 3. Review Results Immediately: The DCF model calculates intrinsic value and NPV in real-time.
- 4. Explore Scenarios: Analyze various forecasts to evaluate different valuation outcomes.
- 5. Present with Assurance: Deliver professional valuation insights to back your strategic decisions.
Why Select This Calculator?
- All-in-One Resource: Offers DCF, WACC, and financial ratio analyses seamlessly integrated.
- Flexible Inputs: Modify the yellow-highlighted fields to explore different scenarios.
- In-Depth Analysis: Automatically computes Kobayashi Pharmaceutical's intrinsic value and Net Present Value.
- Preloaded Information: Historical and projected data provide reliable foundations.
- High-Quality Standards: Perfect for financial analysts, investors, and business consultants.
Who Can Benefit from This Product?
- Investors: Evaluate Kobayashi Pharmaceutical's valuation before making stock transactions.
- CFOs and Financial Analysts: Optimize valuation workflows and assess financial forecasts.
- Startup Founders: Discover the valuation strategies employed by established companies like Kobayashi Pharmaceutical.
- Consultants: Produce comprehensive valuation reports for your clientele.
- Students and Educators: Utilize real-world data to enhance the learning and application of valuation methodologies.
Contents of the Template
- Pre-Filled Data: Includes Kobayashi Pharmaceutical’s historical financials and projections.
- Discounted Cash Flow Model: An editable DCF valuation model with automated calculations.
- Weighted Average Cost of Capital (WACC): A dedicated worksheet for calculating WACC using custom inputs.
- Key Financial Ratios: Evaluate Kobayashi Pharmaceutical’s profitability, efficiency, and leverage.
- Customizable Inputs: Easily adjust revenue growth, margins, and tax rates.
- Clear Dashboard: Visual representations and tables summarizing essential valuation outcomes.
Disclaimer
All information, articles, and product details provided on this website are for general informational and educational purposes only. We do not claim any ownership over, nor do we intend to infringe upon, any trademarks, copyrights, logos, brand names, or other intellectual property mentioned or depicted on this site. Such intellectual property remains the property of its respective owners, and any references here are made solely for identification or informational purposes, without implying any affiliation, endorsement, or partnership.
We make no representations or warranties, express or implied, regarding the accuracy, completeness, or suitability of any content or products presented. Nothing on this website should be construed as legal, tax, investment, financial, medical, or other professional advice. In addition, no part of this site—including articles or product references—constitutes a solicitation, recommendation, endorsement, advertisement, or offer to buy or sell any securities, franchises, or other financial instruments, particularly in jurisdictions where such activity would be unlawful.
All content is of a general nature and may not address the specific circumstances of any individual or entity. It is not a substitute for professional advice or services. Any actions you take based on the information provided here are strictly at your own risk. You accept full responsibility for any decisions or outcomes arising from your use of this website and agree to release us from any liability in connection with your use of, or reliance upon, the content or products found herein.