
|
Takara Bio Inc. (4974.T) DCF Valuation |
Fully Editable: Tailor To Your Needs In Excel Or Sheets
Professional Design: Trusted, Industry-Standard Templates
Investor-Approved Valuation Models
MAC/PC Compatible, Fully Unlocked
No Expertise Is Needed; Easy To Follow
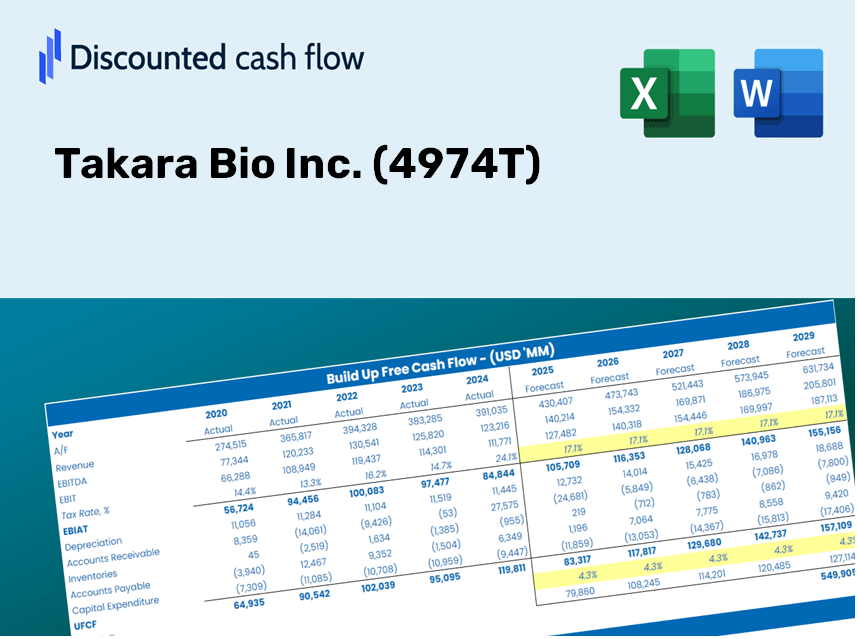
Takara Bio Inc. (4974.T) Bundle
Explore Takara Bio Inc. (4974T) financial prospects with our user-friendly DCF Calculator! Enter your assumptions regarding growth, margins, and expenses to calculate the intrinsic value of Takara Bio Inc. (4974T) and refine your investment approach.
Discounted Cash Flow (DCF) - (USD MM)
| Year | AY1 2020 |
AY2 2021 |
AY3 2022 |
AY4 2023 |
AY5 2024 |
FY1 2025 |
FY2 2026 |
FY3 2027 |
FY4 2028 |
FY5 2029 |
|---|---|---|---|---|---|---|---|---|---|---|
| Revenue | 46,086.0 | 67,699.0 | 78,142.0 | 43,505.0 | 45,039.0 | 46,097.9 | 47,181.6 | 48,290.9 | 49,426.2 | 50,588.2 |
| Revenue Growth, % | 0 | 46.9 | 15.43 | -44.33 | 3.53 | 2.35 | 2.35 | 2.35 | 2.35 | 2.35 |
| EBITDA | 17,362.0 | 31,704.0 | 25,983.0 | 7,899.0 | 6,502.0 | 13,861.4 | 14,187.3 | 14,520.8 | 14,862.2 | 15,211.6 |
| EBITDA, % | 37.67 | 46.83 | 33.25 | 18.16 | 14.44 | 30.07 | 30.07 | 30.07 | 30.07 | 30.07 |
| Depreciation | 3,786.0 | 4,149.0 | 4,735.0 | 5,021.0 | 4,481.0 | 3,862.4 | 3,953.2 | 4,046.1 | 4,141.3 | 4,238.6 |
| Depreciation, % | 8.22 | 6.13 | 6.06 | 11.54 | 9.95 | 8.38 | 8.38 | 8.38 | 8.38 | 8.38 |
| EBIT | 13,576.0 | 27,555.0 | 21,248.0 | 2,878.0 | 2,021.0 | 9,999.0 | 10,234.1 | 10,474.7 | 10,721.0 | 10,973.0 |
| EBIT, % | 29.46 | 40.7 | 27.19 | 6.62 | 4.49 | 21.69 | 21.69 | 21.69 | 21.69 | 21.69 |
| Total Cash | 25,993.0 | 23,633.0 | 51,847.0 | 35,416.0 | 29,549.0 | 28,089.6 | 28,750.0 | 29,425.9 | 30,117.7 | 30,825.8 |
| Total Cash, percent | .0 | .0 | .0 | .0 | .0 | .0 | .0 | .0 | .0 | .0 |
| Account Receivables | 12,585.0 | 17,804.0 | 12,448.0 | 11,285.0 | 14,017.0 | 11,671.8 | 11,946.2 | 12,227.0 | 12,514.5 | 12,808.7 |
| Account Receivables, % | 27.31 | 26.3 | 15.93 | 25.94 | 31.12 | 25.32 | 25.32 | 25.32 | 25.32 | 25.32 |
| Inventories | 9,183.0 | 24,065.0 | 11,087.0 | 11,850.0 | 12,439.0 | 11,480.0 | 11,749.9 | 12,026.1 | 12,308.9 | 12,598.2 |
| Inventories, % | 19.93 | 35.55 | 14.19 | 27.24 | 27.62 | 24.9 | 24.9 | 24.9 | 24.9 | 24.9 |
| Accounts Payable | 2,077.0 | 1,959.0 | 2,323.0 | 1,543.0 | 1,652.0 | 1,621.5 | 1,659.7 | 1,698.7 | 1,738.6 | 1,779.5 |
| Accounts Payable, % | 4.51 | 2.89 | 2.97 | 3.55 | 3.67 | 3.52 | 3.52 | 3.52 | 3.52 | 3.52 |
| Capital Expenditure | -8,845.0 | -12,539.0 | -5,882.0 | -12,778.0 | -9,871.0 | -8,899.6 | -9,108.8 | -9,323.0 | -9,542.1 | -9,766.5 |
| Capital Expenditure, % | -19.19 | -18.52 | -7.53 | -29.37 | -21.92 | -19.31 | -19.31 | -19.31 | -19.31 | -19.31 |
| Tax Rate, % | 47.82 | 47.82 | 47.82 | 47.82 | 47.82 | 47.82 | 47.82 | 47.82 | 47.82 | 47.82 |
| EBITAT | 9,563.9 | 19,865.6 | 16,030.1 | 1,493.0 | 1,054.5 | 6,440.1 | 6,591.5 | 6,746.5 | 6,905.1 | 7,067.4 |
| Depreciation | ||||||||||
| Changes in Account Receivables | ||||||||||
| Changes in Inventories | ||||||||||
| Changes in Accounts Payable | ||||||||||
| Capital Expenditure | ||||||||||
| UFCF | -15,186.1 | -8,743.4 | 33,581.1 | -6,644.0 | -7,547.5 | 4,676.7 | 929.7 | 951.6 | 974.0 | 996.9 |
| WACC, % | 7.27 | 7.27 | 7.27 | 7.26 | 7.26 | 7.27 | 7.27 | 7.27 | 7.27 | 7.27 |
| PV UFCF | ||||||||||
| SUM PV UFCF | 7,376.8 | |||||||||
| Long Term Growth Rate, % | 1.00 | |||||||||
| Free cash flow (T + 1) | 1,007 | |||||||||
| Terminal Value | 16,070 | |||||||||
| Present Terminal Value | 11,317 | |||||||||
| Enterprise Value | 18,694 | |||||||||
| Net Debt | -28,448 | |||||||||
| Equity Value | 47,142 | |||||||||
| Diluted Shares Outstanding, MM | 120 | |||||||||
| Equity Value Per Share | 391.49 |
What You Will Receive
- Comprehensive Financial Model: Access to Takara Bio Inc.’s actual data for an accurate DCF valuation.
- Complete Forecast Control: Modify revenue growth, profit margins, WACC, and other essential parameters.
- Real-Time Calculations: Automatic updates give you immediate insights as you implement changes.
- Professional-Grade Template: A polished Excel file crafted for expert-level valuation.
- Flexible and Reusable: Designed for adaptability, this model can be used repeatedly for in-depth forecasts.
Highlighted Features
- Customizable Forecast Inputs: Adjust essential variables such as revenue growth, EBITDA %, and capital expenditures.
- Instant DCF Valuation: Quickly generates intrinsic value, NPV, and other key metrics at the click of a button.
- High-Precision Results: Leverages Takara Bio Inc.'s (4974T) actual financial data for accurate valuation insights.
- Simplified Scenario Analysis: Easily explore various assumptions and evaluate their impacts on outcomes.
- Efficiency-Boosting Tool: Removes the need to create intricate valuation models from the ground up.
How It Functions
- Download the Template: Gain immediate access to the Excel-based Takara Bio Inc. (4974T) DCF Calculator.
- Input Your Assumptions: Modify the yellow-highlighted cells for growth rates, WACC, margins, and additional factors.
- Instant Calculations: The model updates Takara Bio Inc.'s (4974T) intrinsic value automatically.
- Test Scenarios: Experiment with various assumptions to assess changes in valuation.
- Analyze and Decide: Utilize the results to inform your investment or financial decisions.
Why Choose Takara Bio Inc. (4974T) Calculator?
- Precision: Utilizes accurate Takara Bio financial data for reliable results.
- Customizability: Built to allow users to easily adjust and experiment with inputs.
- Efficiency: Eliminate the need to create a financial model from the ground up.
- Expert-Level: Crafted with the insight and rigor expected at the CFO level.
- Accessible: Intuitive design makes it straightforward for users with varying financial expertise.
Who Should Benefit from This Product?
- Professional Investors: Develop comprehensive and dependable valuation models for portfolio management.
- Corporate Finance Teams: Evaluate valuation scenarios to support strategic decision-making.
- Consultants and Advisors: Deliver precise valuation insights for Takara Bio Inc. (4974T) to clients.
- Students and Educators: Utilize real-world data to learn and teach financial modeling techniques.
- Biotechnology Enthusiasts: Gain insights into the valuation of biotech companies like Takara Bio Inc. (4974T) in the market.
Contents of the Template
- Pre-Filled Data: Features Takara Bio Inc.’s historical financials and projections.
- Discounted Cash Flow Model: An interactive DCF valuation model with automated calculations.
- Weighted Average Cost of Capital (WACC): A specific sheet for calculating WACC based on user-defined inputs.
- Key Financial Ratios: Evaluate Takara Bio Inc.’s profitability, efficiency, and financial leverage.
- Customizable Inputs: Easily modify revenue growth, margins, and tax rates.
- User-Friendly Dashboard: Visuals and tables that summarize key valuation findings.
Disclaimer
All information, articles, and product details provided on this website are for general informational and educational purposes only. We do not claim any ownership over, nor do we intend to infringe upon, any trademarks, copyrights, logos, brand names, or other intellectual property mentioned or depicted on this site. Such intellectual property remains the property of its respective owners, and any references here are made solely for identification or informational purposes, without implying any affiliation, endorsement, or partnership.
We make no representations or warranties, express or implied, regarding the accuracy, completeness, or suitability of any content or products presented. Nothing on this website should be construed as legal, tax, investment, financial, medical, or other professional advice. In addition, no part of this site—including articles or product references—constitutes a solicitation, recommendation, endorsement, advertisement, or offer to buy or sell any securities, franchises, or other financial instruments, particularly in jurisdictions where such activity would be unlawful.
All content is of a general nature and may not address the specific circumstances of any individual or entity. It is not a substitute for professional advice or services. Any actions you take based on the information provided here are strictly at your own risk. You accept full responsibility for any decisions or outcomes arising from your use of this website and agree to release us from any liability in connection with your use of, or reliance upon, the content or products found herein.