
|
Nippon Electric Glass Co., Ltd. (5214.T) DCF Valuation |
Fully Editable: Tailor To Your Needs In Excel Or Sheets
Professional Design: Trusted, Industry-Standard Templates
Investor-Approved Valuation Models
MAC/PC Compatible, Fully Unlocked
No Expertise Is Needed; Easy To Follow
Nippon Electric Glass Co., Ltd. (5214.T) Bundle
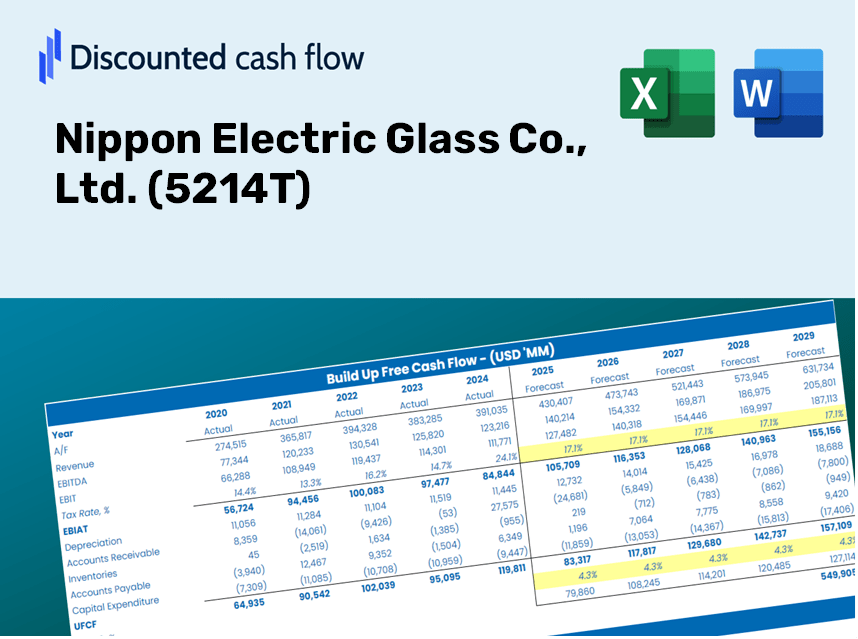
Simplify Nippon Electric Glass Co., Ltd. (5214T) valuation with this customizable DCF Calculator! Featuring real Nippon Electric Glass Co., Ltd. (5214T) financials and adjustable forecast inputs, you can test scenarios and uncover Nippon Electric Glass Co., Ltd. (5214T) fair value in minutes.
Discounted Cash Flow (DCF) - (USD MM)
| Year | AY1 2020 |
AY2 2021 |
AY3 2022 |
AY4 2023 |
AY5 2024 |
FY1 2025 |
FY2 2026 |
FY3 2027 |
FY4 2028 |
FY5 2029 |
|---|---|---|---|---|---|---|---|---|---|---|
| Revenue | 242,886.0 | 292,033.0 | 324,634.0 | 279,974.0 | 299,237.0 | 317,581.2 | 337,050.0 | 357,712.2 | 379,641.2 | 402,914.4 |
| Revenue Growth, % | 0 | 20.23 | 11.16 | -13.76 | 6.88 | 6.13 | 6.13 | 6.13 | 6.13 | 6.13 |
| EBITDA | 45,414.0 | 59,144.0 | 54,293.0 | 9,838.0 | 53,802.0 | 49,014.3 | 52,019.1 | 55,208.0 | 58,592.4 | 62,184.3 |
| EBITDA, % | 18.7 | 20.25 | 16.72 | 3.51 | 17.98 | 15.43 | 15.43 | 15.43 | 15.43 | 15.43 |
| Depreciation | 24,931.0 | 26,721.0 | 28,962.0 | 37,185.0 | 28,937.0 | 32,576.1 | 34,573.1 | 36,692.5 | 38,941.9 | 41,329.2 |
| Depreciation, % | 10.26 | 9.15 | 8.92 | 13.28 | 9.67 | 10.26 | 10.26 | 10.26 | 10.26 | 10.26 |
| EBIT | 20,483.0 | 32,423.0 | 25,331.0 | -27,347.0 | 24,865.0 | 16,438.3 | 17,446.0 | 18,515.5 | 19,650.5 | 20,855.2 |
| EBIT, % | 8.43 | 11.1 | 7.8 | -9.77 | 8.31 | 5.18 | 5.18 | 5.18 | 5.18 | 5.18 |
| Total Cash | 121,440.0 | 134,974.0 | 107,151.0 | 75,401.0 | 123,964.0 | 125,496.9 | 133,190.3 | 141,355.3 | 150,020.8 | 159,217.6 |
| Total Cash, percent | .0 | .0 | .0 | .0 | .0 | .0 | .0 | .0 | .0 | .0 |
| Account Receivables | 59,123.0 | 60,435.0 | 53,606.0 | 59,343.0 | 59,586.0 | 65,204.3 | 69,201.6 | 73,443.9 | 77,946.2 | 82,724.6 |
| Account Receivables, % | 24.34 | 20.69 | 16.51 | 21.2 | 19.91 | 20.53 | 20.53 | 20.53 | 20.53 | 20.53 |
| Inventories | 60,862.0 | 62,099.0 | 102,370.0 | 107,501.0 | 95,243.0 | 94,055.9 | 99,821.8 | 105,941.2 | 112,435.7 | 119,328.4 |
| Inventories, % | 25.06 | 21.26 | 31.53 | 38.4 | 31.83 | 29.62 | 29.62 | 29.62 | 29.62 | 29.62 |
| Accounts Payable | 28,501.0 | 42,539.0 | 52,102.0 | 43,169.0 | 39,444.0 | 45,065.2 | 47,827.9 | 50,759.9 | 53,871.6 | 57,174.1 |
| Accounts Payable, % | 11.73 | 14.57 | 16.05 | 15.42 | 13.18 | 14.19 | 14.19 | 14.19 | 14.19 | 14.19 |
| Capital Expenditure | -25,171.0 | -35,058.0 | -60,002.0 | -29,095.0 | -17,136.0 | -36,185.0 | -38,403.3 | -40,757.5 | -43,256.1 | -45,907.8 |
| Capital Expenditure, % | -10.36 | -12 | -18.48 | -10.39 | -5.73 | -11.39 | -11.39 | -11.39 | -11.39 | -11.39 |
| Tax Rate, % | 49.12 | 49.12 | 49.12 | 49.12 | 49.12 | 49.12 | 49.12 | 49.12 | 49.12 | 49.12 |
| EBITAT | 15,702.0 | 23,115.9 | 18,055.5 | -25,030.2 | 12,651.2 | 11,889.4 | 12,618.3 | 13,391.8 | 14,212.8 | 15,084.1 |
| Depreciation | ||||||||||
| Changes in Account Receivables | ||||||||||
| Changes in Inventories | ||||||||||
| Changes in Accounts Payable | ||||||||||
| Capital Expenditure | ||||||||||
| UFCF | -76,022.0 | 26,267.9 | -36,863.5 | -36,741.2 | 32,742.2 | 9,470.5 | 1,787.6 | 1,897.2 | 2,013.5 | 2,136.9 |
| WACC, % | 4.16 | 4.11 | 4.11 | 4.27 | 3.96 | 4.12 | 4.12 | 4.12 | 4.12 | 4.12 |
| PV UFCF | ||||||||||
| SUM PV UFCF | 15,884.1 | |||||||||
| Long Term Growth Rate, % | 2.00 | |||||||||
| Free cash flow (T + 1) | 2,180 | |||||||||
| Terminal Value | 102,683 | |||||||||
| Present Terminal Value | 83,902 | |||||||||
| Enterprise Value | 99,786 | |||||||||
| Net Debt | -12,699 | |||||||||
| Equity Value | 112,485 | |||||||||
| Diluted Shares Outstanding, MM | 85 | |||||||||
| Equity Value Per Share | 1,317.93 |
What You Will Receive
- Verified NEG Financial Data: Pre-loaded with Nippon Electric Glass’s historical and projected financial metrics for thorough analysis.
- Completely Customizable Template: Easily adjust critical parameters such as revenue growth, WACC, and EBITDA %.
- Real-Time Calculations: Instantly view updates to Nippon Electric Glass's intrinsic value as you make changes.
- Professional Valuation Resource: Tailored for investors, analysts, and consultants seeking reliable DCF outcomes.
- User-Friendly Interface: Intuitive layout and straightforward instructions suitable for all skill levels.
Key Features
- Customizable Forecast Inputs: Adjust essential metrics such as revenue growth, EBITDA margin, and capital investments.
- Instant DCF Valuation: Quickly computes intrinsic value, NPV, and other financial metrics.
- High-Precision Accuracy: Leverages Nippon Electric Glass Co., Ltd.'s actual financial data for authentic valuation results.
- Streamlined Scenario Analysis: Effortlessly evaluate various assumptions and assess different outcomes.
- Efficiency-Enhancing Tool: Avoid the hassle of constructing intricate valuation models from the ground up.
How It Works
- Step 1: Download the Excel spreadsheet.
- Step 2: Examine the pre-filled data for Nippon Electric Glass Co., Ltd. (5214T) (historical and projected).
- Step 3: Modify key assumptions (highlighted yellow cells) according to your analysis.
- Step 4: Observe automatic recalculations for Nippon Electric Glass Co., Ltd.'s intrinsic value.
- Step 5: Utilize the results for investment decisions or reporting purposes.
Why Choose This Calculator for Nippon Electric Glass Co., Ltd. (5214T)?
- Precise Data: Authentic financials from Nippon Electric Glass Co., Ltd. ensure dependable valuation outcomes.
- Tailored Options: Modify essential parameters such as growth rates, WACC, and tax rates to align with your forecasts.
- Efficiency Boost: Built-in calculations save time, so you don’t have to start from the ground up.
- Professional Quality: Crafted for investors, analysts, and consultants seeking accuracy.
- Easy to Use: User-friendly design and clear step-by-step guidance make it accessible for everyone.
Who Can Benefit from Nippon Electric Glass Co., Ltd. (5214T)?
- Investors: Make informed investment choices with a robust valuation tool tailored for precision.
- Financial Analysts: Streamline your workflow with a customizable DCF model designed for efficiency.
- Consultants: Effortlessly modify the template for impactful client presentations or insightful reports.
- Finance Enthusiasts: Enhance your knowledge of valuation methods through practical, real-world applications.
- Educators and Students: Utilize it as an effective resource for hands-on learning in finance-related studies.
What the Template Contains for Nippon Electric Glass Co., Ltd. (5214T)
- Historical Data: Comprehensive records of Nippon Electric Glass’s previous financial performance and foundational forecasts.
- DCF and Levered DCF Models: In-depth templates to estimate the intrinsic value of Nippon Electric Glass.
- WACC Sheet: Pre-configured calculations for the Weighted Average Cost of Capital.
- Editable Inputs: Adjust essential drivers such as growth rates, EBITDA percentages, and CAPEX assumptions.
- Quarterly and Annual Statements: An exhaustive analysis of Nippon Electric Glass’s financials.
- Interactive Dashboard: Dynamically visualize valuation results and forecasts.
Disclaimer
All information, articles, and product details provided on this website are for general informational and educational purposes only. We do not claim any ownership over, nor do we intend to infringe upon, any trademarks, copyrights, logos, brand names, or other intellectual property mentioned or depicted on this site. Such intellectual property remains the property of its respective owners, and any references here are made solely for identification or informational purposes, without implying any affiliation, endorsement, or partnership.
We make no representations or warranties, express or implied, regarding the accuracy, completeness, or suitability of any content or products presented. Nothing on this website should be construed as legal, tax, investment, financial, medical, or other professional advice. In addition, no part of this site—including articles or product references—constitutes a solicitation, recommendation, endorsement, advertisement, or offer to buy or sell any securities, franchises, or other financial instruments, particularly in jurisdictions where such activity would be unlawful.
All content is of a general nature and may not address the specific circumstances of any individual or entity. It is not a substitute for professional advice or services. Any actions you take based on the information provided here are strictly at your own risk. You accept full responsibility for any decisions or outcomes arising from your use of this website and agree to release us from any liability in connection with your use of, or reliance upon, the content or products found herein.