
|
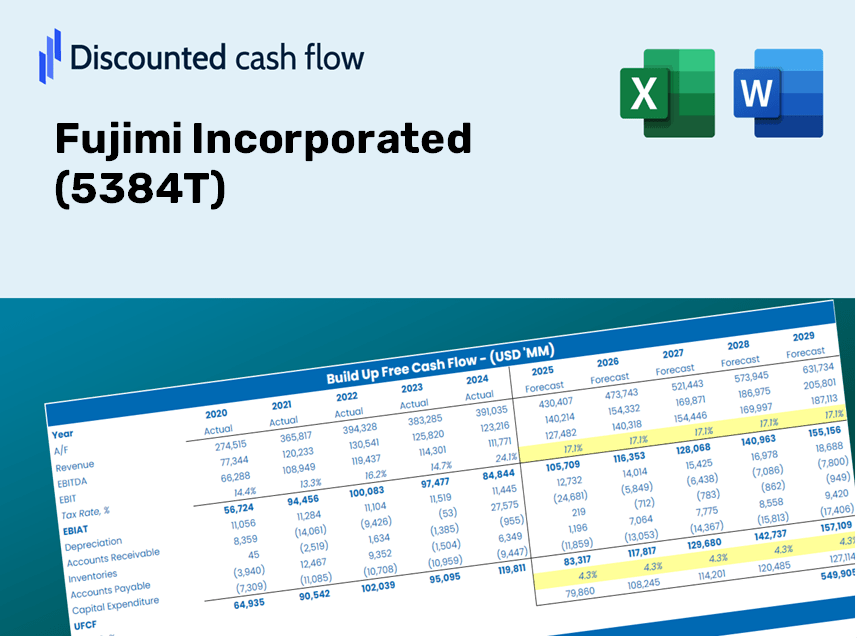
Fujimi Incorporated (5384.T) DCF Valuation |
Fully Editable: Tailor To Your Needs In Excel Or Sheets
Professional Design: Trusted, Industry-Standard Templates
Investor-Approved Valuation Models
MAC/PC Compatible, Fully Unlocked
No Expertise Is Needed; Easy To Follow
Fujimi Incorporated (5384.T) Bundle
Discover the true worth of Fujimi Incorporated with our advanced DCF Calculator! Adjust key assumptions, explore various scenarios, and evaluate how changes affect Fujimi Incorporated's valuation – all within one user-friendly Excel template.
Discounted Cash Flow (DCF) - (USD MM)
| Year | AY1 2020 |
AY2 2021 |
AY3 2022 |
AY4 2023 |
AY5 2024 |
FY1 2025 |
FY2 2026 |
FY3 2027 |
FY4 2028 |
FY5 2029 |
|---|---|---|---|---|---|---|---|---|---|---|
| Revenue | 41,956.0 | 51,731.0 | 58,394.0 | 51,423.0 | 62,503.0 | 69,657.6 | 77,631.2 | 86,517.5 | 96,420.9 | 107,458.1 |
| Revenue Growth, % | 0 | 23.3 | 12.88 | -11.94 | 21.55 | 11.45 | 11.45 | 11.45 | 11.45 | 11.45 |
| EBITDA | 8,933.0 | 14,049.0 | 15,243.0 | 10,780.0 | 14,273.0 | 16,488.2 | 18,375.6 | 20,479.0 | 22,823.2 | 25,435.7 |
| EBITDA, % | 21.29 | 27.16 | 26.1 | 20.96 | 22.84 | 23.67 | 23.67 | 23.67 | 23.67 | 23.67 |
| Depreciation | 1,687.0 | 1,661.0 | 1,730.0 | 2,061.0 | 2,018.0 | 2,428.4 | 2,706.4 | 3,016.2 | 3,361.4 | 3,746.2 |
| Depreciation, % | 4.02 | 3.21 | 2.96 | 4.01 | 3.23 | 3.49 | 3.49 | 3.49 | 3.49 | 3.49 |
| EBIT | 7,246.0 | 12,388.0 | 13,513.0 | 8,719.0 | 12,255.0 | 14,059.8 | 15,669.2 | 17,462.9 | 19,461.8 | 21,689.6 |
| EBIT, % | 17.27 | 23.95 | 23.14 | 16.96 | 19.61 | 20.18 | 20.18 | 20.18 | 20.18 | 20.18 |
| Total Cash | 31,324.0 | 36,562.0 | 36,238.0 | 34,926.0 | 27,857.0 | 44,564.4 | 49,665.6 | 55,350.8 | 61,686.7 | 68,747.8 |
| Total Cash, percent | .0 | .0 | .0 | .0 | .0 | .0 | .0 | .0 | .0 | .0 |
| Account Receivables | 9,085.0 | 11,566.0 | 11,230.0 | 12,198.0 | 12,778.0 | 14,963.5 | 16,676.4 | 18,585.3 | 20,712.7 | 23,083.7 |
| Account Receivables, % | 21.65 | 22.36 | 19.23 | 23.72 | 20.44 | 21.48 | 21.48 | 21.48 | 21.48 | 21.48 |
| Inventories | 7,325.0 | 9,324.0 | 13,600.0 | 13,999.0 | 14,059.0 | 15,114.2 | 16,844.3 | 18,772.5 | 20,921.3 | 23,316.1 |
| Inventories, % | 17.46 | 18.02 | 23.29 | 27.22 | 22.49 | 21.7 | 21.7 | 21.7 | 21.7 | 21.7 |
| Accounts Payable | 2,880.0 | 3,986.0 | 4,247.0 | 3,315.0 | 4,230.0 | 4,883.9 | 5,443.0 | 6,066.0 | 6,760.4 | 7,534.3 |
| Accounts Payable, % | 6.86 | 7.71 | 7.27 | 6.45 | 6.77 | 7.01 | 7.01 | 7.01 | 7.01 | 7.01 |
| Capital Expenditure | -1,287.0 | -1,616.0 | -1,762.0 | -3,738.0 | -12,574.0 | -5,098.3 | -5,681.9 | -6,332.3 | -7,057.1 | -7,864.9 |
| Capital Expenditure, % | -3.07 | -3.12 | -3.02 | -7.27 | -20.12 | -7.32 | -7.32 | -7.32 | -7.32 | -7.32 |
| Tax Rate, % | 23.03 | 23.03 | 23.03 | 23.03 | 23.03 | 23.03 | 23.03 | 23.03 | 23.03 | 23.03 |
| EBITAT | 5,610.1 | 9,160.4 | 10,598.7 | 6,503.5 | 9,432.1 | 10,723.6 | 11,951.2 | 13,319.2 | 14,843.8 | 16,543.0 |
| Depreciation | ||||||||||
| Changes in Account Receivables | ||||||||||
| Changes in Inventories | ||||||||||
| Changes in Accounts Payable | ||||||||||
| Capital Expenditure | ||||||||||
| UFCF | -7,519.9 | 5,831.4 | 6,887.7 | 2,527.5 | -848.9 | 5,466.9 | 6,091.8 | 6,789.1 | 7,566.2 | 8,432.3 |
| WACC, % | 4.73 | 4.73 | 4.73 | 4.73 | 4.73 | 4.73 | 4.73 | 4.73 | 4.73 | 4.73 |
| PV UFCF | ||||||||||
| SUM PV UFCF | 29,664.6 | |||||||||
| Long Term Growth Rate, % | 2.00 | |||||||||
| Free cash flow (T + 1) | 8,601 | |||||||||
| Terminal Value | 314,898 | |||||||||
| Present Terminal Value | 249,912 | |||||||||
| Enterprise Value | 279,576 | |||||||||
| Net Debt | -27,857 | |||||||||
| Equity Value | 307,433 | |||||||||
| Diluted Shares Outstanding, MM | 74 | |||||||||
| Equity Value Per Share | 4,144.24 |
Your Benefits
- Customizable Excel Template: A fully adjustable Excel-based DCF Calculator featuring pre-populated financial data for Fujimi Incorporated (5384T).
- Accurate Historical Insights: Access to historical data and future estimates (displayed in the highlighted cells).
- Adjustable Projections: Modify key assumptions like revenue growth, EBITDA percentage, and WACC.
- Instant Calculations: Quickly observe how your inputs influence Fujimi Incorporated's (5384T) valuation.
- Professional Resource: Designed for investors, CFOs, consultants, and financial analysts.
- Intuitive Layout: Organized for clarity and simplicity, complete with step-by-step guidance.
Key Features
- Real-Time Fujimi Data: Pre-loaded with Fujimi Incorporated's historical financial performance and future projections.
- Completely Customizable Inputs: Modify growth rates, profit margins, discount rates, tax percentages, and capital investment plans.
- Adaptive Valuation Model: Automatically recalculates Net Present Value (NPV) and intrinsic value based on your adjustments.
- Scenario Analysis: Generate various forecasting scenarios to evaluate different valuation results.
- Intuitive Interface: Designed with simplicity in mind, catering to both seasoned professionals and newcomers.
How It Functions
- Step 1: Download the prebuilt Excel template featuring Fujimi Incorporated’s (5384T) data.
- Step 2: Review the pre-filled sheets to familiarize yourself with the essential metrics.
- Step 3: Modify forecasts and assumptions in the editable yellow cells (WACC, growth, margins).
- Step 4: Immediately see the recalculated outcomes, including Fujimi Incorporated’s (5384T) intrinsic value.
- Step 5: Use the generated outputs to make informed investment decisions or create reports.
Why Opt for This Calculator?
- User-Friendly: Tailored for both novices and seasoned users.
- Customizable Inputs: Modify parameters effortlessly to suit your analysis.
- Real-Time Adjustments: Observe immediate updates to Fujimi Incorporated's valuation as you change inputs.
- Pre-Configured: Comes with Fujimi Incorporated's (5384T) actual financial data for swift evaluations.
- Relied Upon by Experts: Preferred by investors and analysts for making well-informed choices.
Who Can Benefit from This Product?
- Professional Investors: Create comprehensive and trustworthy valuation models for portfolio assessments related to Fujimi Incorporated (5384T).
- Corporate Finance Teams: Evaluate valuation scenarios that inform strategic decisions within the organization.
- Consultants and Advisors: Deliver precise valuation insights to clients considering investments in Fujimi Incorporated (5384T).
- Students and Educators: Apply real-world data for practicing and teaching financial modeling techniques.
- Tech Enthusiasts: Gain insight into how companies like Fujimi Incorporated (5384T) are valued in the market.
What the Template Contains
- Historical Data: Includes Fujimi Incorporated's past financial records and baseline projections.
- DCF and Levered DCF Models: Comprehensive templates to assess the intrinsic value of Fujimi Incorporated (5384T).
- WACC Sheet: Pre-configured calculations for the Weighted Average Cost of Capital.
- Editable Inputs: Adjust key parameters such as growth rates, EBITDA %, and CAPEX assumptions.
- Quarterly and Annual Statements: A thorough analysis of Fujimi Incorporated's financial performance.
- Interactive Dashboard: Explore valuation outcomes and projections in a dynamic visual format.
Disclaimer
All information, articles, and product details provided on this website are for general informational and educational purposes only. We do not claim any ownership over, nor do we intend to infringe upon, any trademarks, copyrights, logos, brand names, or other intellectual property mentioned or depicted on this site. Such intellectual property remains the property of its respective owners, and any references here are made solely for identification or informational purposes, without implying any affiliation, endorsement, or partnership.
We make no representations or warranties, express or implied, regarding the accuracy, completeness, or suitability of any content or products presented. Nothing on this website should be construed as legal, tax, investment, financial, medical, or other professional advice. In addition, no part of this site—including articles or product references—constitutes a solicitation, recommendation, endorsement, advertisement, or offer to buy or sell any securities, franchises, or other financial instruments, particularly in jurisdictions where such activity would be unlawful.
All content is of a general nature and may not address the specific circumstances of any individual or entity. It is not a substitute for professional advice or services. Any actions you take based on the information provided here are strictly at your own risk. You accept full responsibility for any decisions or outcomes arising from your use of this website and agree to release us from any liability in connection with your use of, or reliance upon, the content or products found herein.