
|
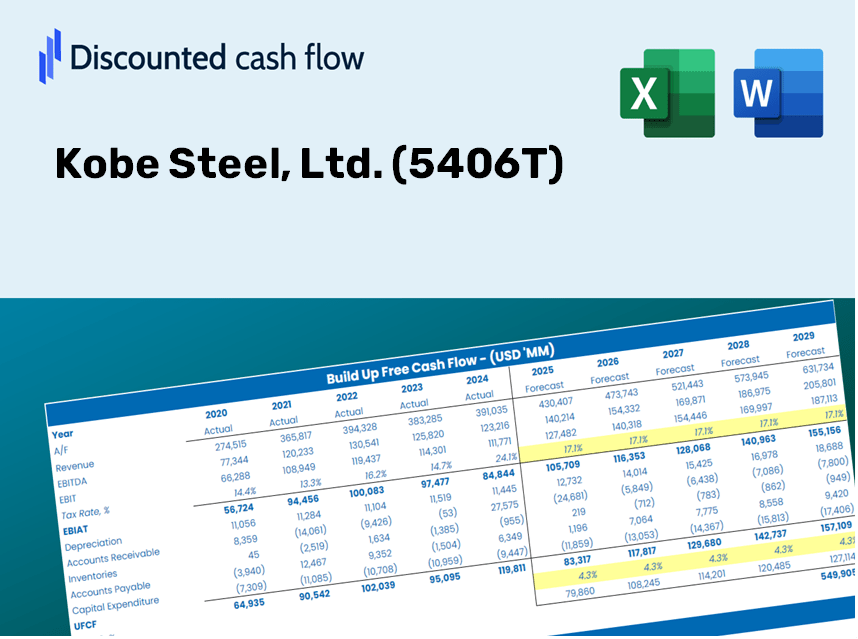
Kobe Steel, Ltd. (5406.T) DCF Valuation |
Fully Editable: Tailor To Your Needs In Excel Or Sheets
Professional Design: Trusted, Industry-Standard Templates
Investor-Approved Valuation Models
MAC/PC Compatible, Fully Unlocked
No Expertise Is Needed; Easy To Follow
Kobe Steel, Ltd. (5406.T) Bundle
Explore the financial future of Kobe Steel, Ltd. (5406T) with our user-friendly DCF Calculator! Enter your assumptions for growth, margins, and costs to calculate the intrinsic value of Kobe Steel, Ltd. (5406T) and refine your investment strategy.
What You Will Receive
- Authentic 5406T Financials: Access to both historical and projected data for precise valuation.
- Customizable Inputs: Adjust WACC, tax rates, revenue growth, and capital expenditures as needed.
- Real-Time Calculations: Intrinsic value and NPV calculated automatically as changes are made.
- Scenario Analysis: Evaluate various scenarios to assess Kobe Steel's future performance.
- User-Friendly Design: Tailored for professionals, yet easy for newcomers to navigate.
Key Features
- Real-Life 5406T Data: Pre-filled with Kobe Steel’s historical financials and future projections.
- Fully Customizable Inputs: Adjust revenue growth rates, profit margins, WACC, tax rates, and capital expenditures.
- Dynamic Valuation Model: Automatic updates to Net Present Value (NPV) and intrinsic value based on your input selections.
- Scenario Testing: Create multiple forecasting scenarios to evaluate various valuation outcomes.
- User-Friendly Design: Intuitive, structured layout designed for both professionals and novices.
How It Works
- Step 1: Download the Excel file.
- Step 2: Review Kobe Steel's pre-filled financial data and projections.
- Step 3: Adjust key inputs such as revenue growth, WACC, and tax rates (highlighted cells).
- Step 4: Observe the DCF model update in real-time as you modify your assumptions.
- Step 5: Evaluate the results and leverage the insights for your investment strategies.
Why Choose Kobe Steel, Ltd. (5406T)?
- Save Time: Skip the hassle of building complex models from the ground up – our tools are ready to go.
- Enhance Precision: Dependable financial insights and formulas help minimize valuation errors.
- Completely Customizable: Adjust the model to fit your unique assumptions and forecasts.
- User-Friendly: Intuitive charts and outputs simplify data interpretation and analysis.
- Approved by Professionals: Crafted for industry experts who prioritize accuracy and functionality.
Who Should Benefit from Kobe Steel, Ltd. (5406T)?
- Engineering Students: Discover industry-specific valuation methods and apply them using real-world data.
- Researchers: Integrate advanced models into academic studies or projects related to the steel industry.
- Investors: Evaluate your investment strategies and assess the valuation results for Kobe Steel stock.
- Market Analysts: Enhance your analysis with a customizable DCF model tailored for Kobe Steel.
- Manufacturing Entrepreneurs: Understand how major players like Kobe Steel are appraised in the market.
Overview of the Template Components
- Historical Data: Comprises Kobe Steel’s past financial results and foundational forecasts.
- DCF and Levered DCF Models: Comprehensive templates designed to assess Kobe Steel’s intrinsic value.
- WACC Sheet: Ready-to-use calculations for the Weighted Average Cost of Capital.
- Editable Inputs: Customize key parameters such as growth rates, EBITDA percentages, and CAPEX assumptions.
- Quarterly and Annual Statements: A thorough analysis of Kobe Steel’s financial performance.
- Interactive Dashboard: Dynamically visualize valuation outcomes and forecasts.
Disclaimer
All information, articles, and product details provided on this website are for general informational and educational purposes only. We do not claim any ownership over, nor do we intend to infringe upon, any trademarks, copyrights, logos, brand names, or other intellectual property mentioned or depicted on this site. Such intellectual property remains the property of its respective owners, and any references here are made solely for identification or informational purposes, without implying any affiliation, endorsement, or partnership.
We make no representations or warranties, express or implied, regarding the accuracy, completeness, or suitability of any content or products presented. Nothing on this website should be construed as legal, tax, investment, financial, medical, or other professional advice. In addition, no part of this site—including articles or product references—constitutes a solicitation, recommendation, endorsement, advertisement, or offer to buy or sell any securities, franchises, or other financial instruments, particularly in jurisdictions where such activity would be unlawful.
All content is of a general nature and may not address the specific circumstances of any individual or entity. It is not a substitute for professional advice or services. Any actions you take based on the information provided here are strictly at your own risk. You accept full responsibility for any decisions or outcomes arising from your use of this website and agree to release us from any liability in connection with your use of, or reliance upon, the content or products found herein.