
|
Fujikura Ltd. (5803.T): BCG Matrix |
Fully Editable: Tailor To Your Needs In Excel Or Sheets
Professional Design: Trusted, Industry-Standard Templates
Investor-Approved Valuation Models
MAC/PC Compatible, Fully Unlocked
No Expertise Is Needed; Easy To Follow
Fujikura Ltd. (5803.T) Bundle
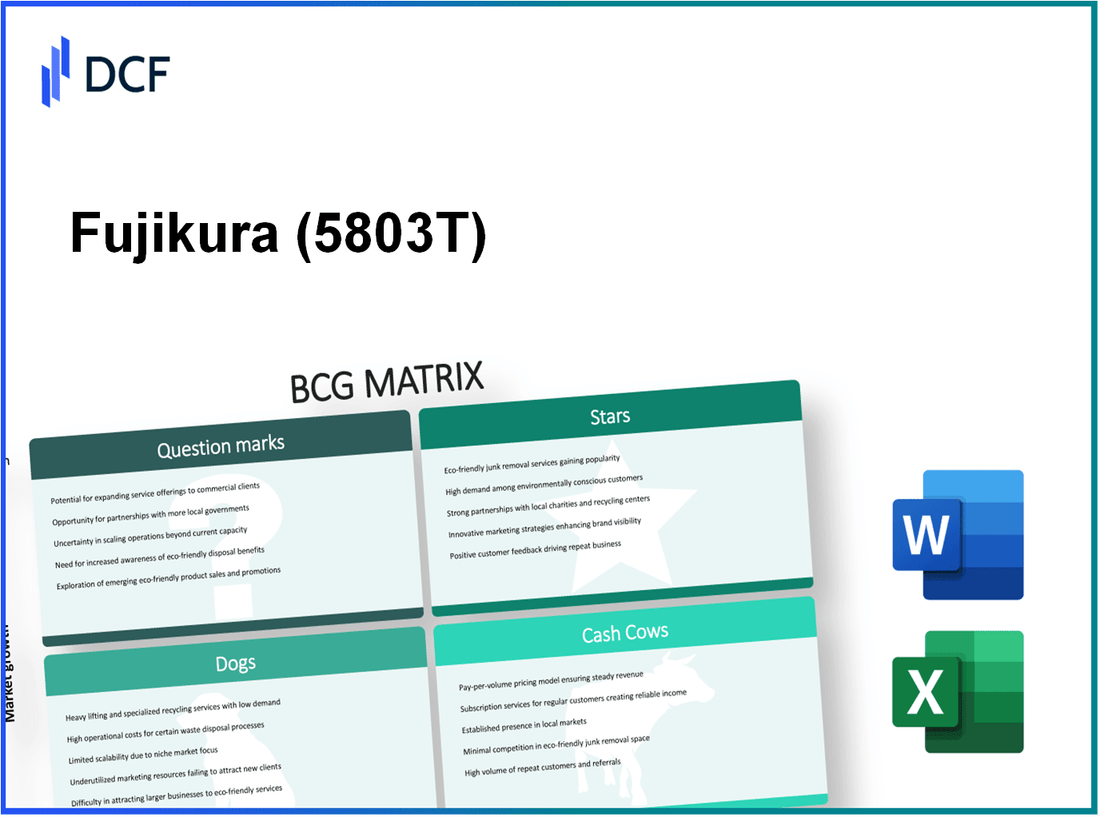
As the global market continues to evolve, understanding a company's position through the lens of the Boston Consulting Group Matrix can reveal vital insights into its strategic portfolio. Fujikura Ltd., a key player in the cable and telecommunications industry, showcases a compelling mix of Stars, Cash Cows, Dogs, and Question Marks. Dive into this analysis to explore which segments drive growth, which ones deliver stable returns, and where the potential for innovation lies.
Background of Fujikura Ltd.
Fujikura Ltd. is a leading Japanese company established in 1885, primarily engaged in the manufacturing of optical fiber and cable products. Headquartered in Tokyo, Japan, Fujikura operates across various industries, including telecommunications, electronics, energy, and automotive sectors. The company has a strong international presence, with subsidiaries and offices in more than 30 countries worldwide.
Fujikura is best known for its innovations in optical communications, particularly its advanced fusion splicing technologies. The company’s flagship products include optical fiber cables, which are crucial for high-speed internet infrastructure, and diverse electronic components, such as sensors and connectors. As of the fiscal year ending March 2023, Fujikura reported revenue of approximately ¥745 billion (around $5.6 billion), showing a consistent growth trajectory over the past several years.
Strategically, Fujikura has focused on research and development, allocating significant resources to innovate and expand its product offerings. In recent years, it has also embraced sustainability practices, aiming to reduce its environmental footprint while fulfilling the increasing demand for its products. The company's commitment to quality and technology has positioned it as a key player in the global market for fiber optics and electronic components.
Notably, Fujikura’s stock is listed on the Tokyo Stock Exchange under the ticker symbol 5803. The company has seen fluctuations in its stock price, reflective of global market trends and economic conditions. Over the past year, its share price has fluctuated between ¥1,200 and ¥1,600, with a market capitalization hovering around ¥400 billion as of October 2023.
Fujikura Ltd. - BCG Matrix: Stars
Fujikura Ltd. has several business units that can be classified as Stars, showcasing high growth and significant market share. These segments are critical for the company's current and future profitability.
Optical Fiber Cables
The optical fiber cable segment has seen substantial growth, driven by increasing demand in telecommunications and data centers. In fiscal year 2022, Fujikura's revenue from optical fiber and related products reached approximately ¥93 billion, highlighting a year-on-year growth rate of 15%.
Fujikura holds a market share of around 20% in the global optical fiber market, which is projected to grow at a CAGR of 8% from 2023 to 2028. This growth is fueled by the expansion of 5G networks and undersea cable projects.
Automotive Products
In the automotive sector, Fujikura specializes in wire harnesses and electronic components, crucial for modern vehicles. The revenue generated from automotive products reached approximately ¥65 billion in the latest financial year, with a growth of 10% compared to the previous year.
The market for automotive wire harnesses is expected to grow at a CAGR of 6% through the next few years, driven by the shift towards electric vehicles (EVs) and advanced driver-assistance systems (ADAS). Fujikura's market share in this segment stands at roughly 15%, positioning it as a key player amidst increasing competition.
High-Voltage Cables
Fujikura's high-voltage cable segment is another strong performer. The company reported revenues of approximately ¥45 billion from this division in fiscal year 2022, marking a growth of 12%.
This segment benefits from increasing global investments in renewable energy and grid upgrades. The high-voltage cable market is forecasted to grow at a CAGR of 7% from 2023 to 2030. Fujikura holds about 18% of the market share in this category, making it a dominant force.
| Segment | Revenue (¥ Billion) | Growth Rate (%) | Market Share (%) | Market CAGR (%) |
|---|---|---|---|---|
| Optical Fiber Cables | 93 | 15 | 20 | 8 |
| Automotive Products | 65 | 10 | 15 | 6 |
| High-Voltage Cables | 45 | 12 | 18 | 7 |
These Stars within Fujikura Ltd.'s portfolio demonstrate the company's ability to maintain high market shares while contributing significantly to cash flow, thereby enabling continuous investment for future growth initiatives. The focus on fostering these segments is essential for transitioning them into Cash Cows in the long run.
Fujikura Ltd. - BCG Matrix: Cash Cows
Fujikura Ltd. operates in various sectors, with certain products qualifying as Cash Cows under the BCG Matrix due to their high market share and stable profitability in mature markets. Here, we explore three key product categories that illustrate this status.
Traditional Copper Cables
Fujikura has established a strong presence in the traditional copper cable market. The global market for copper cables was valued at approximately $24 billion in 2022, with a projected growth rate of around 3.5% annually. Fujikura holds a significant market share of around 15% in this segment.
Profit margins for traditional copper cables are robust, averaging around 20%. This segment generates considerable cash flow, allowing the company to support developments in other areas. The total revenue attributed to copper cables for Fujikura in the last fiscal year was approximately $1.5 billion.
Power Transmission Cables
In the power transmission cable market, Fujikura continues to be a dominant player. The power cable market is estimated to have reached $30 billion in 2022, with a growth rate of about 2.5%. Fujikura commands a market share of approximately 10%, which translates into significant cash generation regardless of the slow growth.
This segment particularly emphasizes high-profit margins, averaging around 18%. Revenue from power transmission cables for the last fiscal year was reported at approximately $800 million. This steady income stream underscores the importance of this segment in funding other investments within the company.
Electrical Wiring for Residential
The electrical wiring sector, especially for residential applications, contributes significantly to Fujikura's cash flow. The market for residential electrical wiring is valued at roughly $15 billion as of 2022, with modest growth expectations of around 3%. Fujikura's market share in this category rests at about 12%.
The profit margins in this segment are approximately 25%, one of the highest across Fujikura’s product lines. The company's revenue from residential wiring reached approximately $600 million in the last fiscal year, reinforcing the strategic importance of this cash cow.
| Product Category | Market Value (2022) | Market Growth Rate | Fujikura's Market Share | Profit Margin | Revenue (Last Fiscal Year) |
|---|---|---|---|---|---|
| Traditional Copper Cables | $24 billion | 3.5% | 15% | 20% | $1.5 billion |
| Power Transmission Cables | $30 billion | 2.5% | 10% | 18% | $800 million |
| Electrical Wiring for Residential | $15 billion | 3% | 12% | 25% | $600 million |
Fujikura's Cash Cows exemplify the company's ability to maintain a solid cash flow without substantial additional investments. This financial stability plays a crucial role in supporting research, development, and overall operations, allowing the company to navigate the complexities of the market effectively.
Fujikura Ltd. - BCG Matrix: Dogs
Fujikura Ltd. has several product lines that fall under the category of 'Dogs' in the BCG Matrix. These are products facing stagnant growth and have low market shares, leading to limited profitability. Here are the primary components classified as Dogs:
Outdated Telecommunication Products
The market for traditional telecommunication products has seen a significant decline due to advancements in technology and the shift towards digital communications. In Fujikura's financial report for FY 2022, it was noted that revenues from outdated telecommunication products accounted for approximately 5% of the total sales, down from 10% in FY 2020. This decline can be attributed to reduced demand for copper-based solutions as more companies transition to fiber optics.
Older Industrial Cable Lines
Fujikura's older industrial cable lines are also categorized as Dogs. These segments experienced a revenue drop of approximately 12% from FY 2021 to FY 2022, reflecting the overall industry trend towards newer, more efficient materials and technologies. In FY 2022, the industrial cable segment generated revenues of ¥15 billion (approximately $115 million), but with a market share of only 3% in an increasingly competitive market.
| Product Category | FY 2021 Revenue (¥ billion) | FY 2022 Revenue (¥ billion) | Market Share (%) | Growth Rate (%) |
|---|---|---|---|---|
| Outdated Telecommunication Products | ¥12 | ¥8 | 5 | -20 |
| Older Industrial Cable Lines | ¥17 | ¥15 | 3 | -12 |
Legacy Testing Solutions
Legacy testing solutions have similarly struggled with stagnation. In 2022, this segment reported revenues of ¥10 billion (around $76 million), representing a 10% decline from FY 2021. The market for testing solutions has shifted towards more comprehensive, integrated systems, leaving Fujikura's older offerings less competitive. This segment holds a market share of approximately 4%, making it another candidate for divestiture.
| Segment | FY 2021 Revenue (¥ billion) | FY 2022 Revenue (¥ billion) | Market Share (%) | Growth Rate (%) |
|---|---|---|---|---|
| Legacy Testing Solutions | ¥11 | ¥10 | 4 | -10 |
Given the financial underperformance and market dynamics surrounding these products, Fujikura Ltd. faces significant challenges in these areas. The strategic focus may need to be shifted towards innovation and divestment rather than continuing to invest in these 'Dogs.'
Fujikura Ltd. - BCG Matrix: Question Marks
Fujikura Ltd. has strategically invested in various segments that could be classified as Question Marks within the BCG Matrix framework. These segments exhibit high growth potential, yet they struggle with low market share. Below is an analysis of three specific areas where Fujikura is focusing its efforts: Emerging Renewable Energy Solutions, Smart Grid Technology, and Advanced Data Center Solutions.
Emerging Renewable Energy Solutions
The global renewable energy market is expected to grow from $1.5 trillion in 2021 to approximately $2.5 trillion by 2026, representing a CAGR of around 10%. Despite this growth, Fujikura's market share in renewable energy solutions remains below 5%, which categorizes it as a Question Mark.
In 2022, Fujikura announced a new range of photovoltaic cable products aimed at the solar energy sector. These products are critical for solar panel installations, a market projected to grow significantly as countries push for greener energy sources. However, the company's sales from these products were reported at approximately $50 million, a modest figure compared to larger competitors like Nexans and Prysmian Group, which dominate the market with over 15% market share each.
Smart Grid Technology
The smart grid market is anticipated to grow from $25 billion in 2022 to approximately $100 billion by 2028, with a CAGR of about 25%. Fujikura's current involvement in smart grid technology represents a mere 3% market share, positioning it as a Question Mark. The company has launched several initiatives, including fiber optic solutions for smart meters, but revenue remains low, estimated at around $30 million in 2022.
The challenge for Fujikura lies in increasing its penetration within this high-potential sector. Investment in marketing and partnerships with utility companies could enhance visibility and adoption of their smart grid solutions, as competition intensifies with players like Siemens and GE, who hold significant market shares.
Advanced Data Center Solutions
The global data center market is expected to reach $200 billion by the end of 2023, growing at a CAGR of approximately 5%. Fujikura's advanced data center solutions currently capture less than 4% of this market. In 2022, the revenue generated from these solutions was reported at about $40 million, significantly trailing established competitors such as Cisco and Dell Technologies.
Fujikura’s strategy to enhance product offerings in cooling, cabling, and energy-efficient technologies presents a pathway to capture more market share. However, the company must commit substantial resources to marketing and product development to transform these offerings from Question Marks into Stars.
| Segment | Market Size (2023) | Projected Market Size (2028) | Current Market Share | Current Revenue (2022) |
|---|---|---|---|---|
| Emerging Renewable Energy Solutions | $1.5 trillion | $2.5 trillion | 5% | $50 million |
| Smart Grid Technology | $25 billion | $100 billion | 3% | $30 million |
| Advanced Data Center Solutions | $200 billion | $200 billion | 4% | $40 million |
In conclusion, Fujikura Ltd. faces substantial opportunities and challenges in its Question Mark segments. While these areas show significant growth potential, immediate action is necessary to bolster market share and secure a stronger foothold in these emerging markets.
Understanding the positioning of Fujikura Ltd. within the BCG Matrix illuminates the strategic direction of the company, showcasing its strengths in high-growth areas like optical fiber cables and automotive products, while also identifying potential challenges in outdated sectors. By focusing on nurturing its Stars and strategically managing its Cash Cows, Fujikura can optimize resources, seize opportunities in the Question Marks, and phase out the Dogs, ensuring sustained growth and innovation in a competitive market.
[right_small]Disclaimer
All information, articles, and product details provided on this website are for general informational and educational purposes only. We do not claim any ownership over, nor do we intend to infringe upon, any trademarks, copyrights, logos, brand names, or other intellectual property mentioned or depicted on this site. Such intellectual property remains the property of its respective owners, and any references here are made solely for identification or informational purposes, without implying any affiliation, endorsement, or partnership.
We make no representations or warranties, express or implied, regarding the accuracy, completeness, or suitability of any content or products presented. Nothing on this website should be construed as legal, tax, investment, financial, medical, or other professional advice. In addition, no part of this site—including articles or product references—constitutes a solicitation, recommendation, endorsement, advertisement, or offer to buy or sell any securities, franchises, or other financial instruments, particularly in jurisdictions where such activity would be unlawful.
All content is of a general nature and may not address the specific circumstances of any individual or entity. It is not a substitute for professional advice or services. Any actions you take based on the information provided here are strictly at your own risk. You accept full responsibility for any decisions or outcomes arising from your use of this website and agree to release us from any liability in connection with your use of, or reliance upon, the content or products found herein.