
|
Shanghai Electric Power Co., Ltd. (600021.SS) DCF Valuation |
Fully Editable: Tailor To Your Needs In Excel Or Sheets
Professional Design: Trusted, Industry-Standard Templates
Investor-Approved Valuation Models
MAC/PC Compatible, Fully Unlocked
No Expertise Is Needed; Easy To Follow
Shanghai Electric Power Co., Ltd. (600021.SS) Bundle
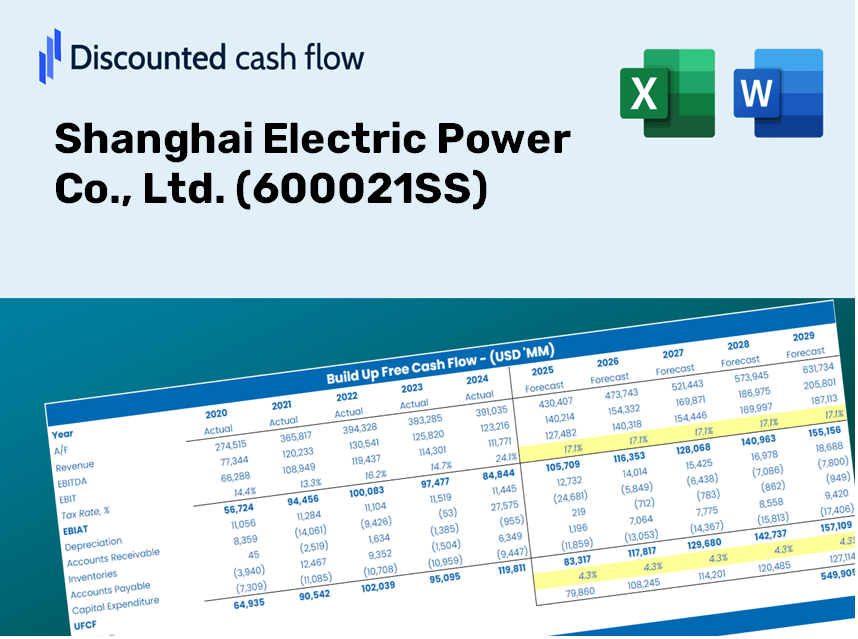
Discover the true value of Shanghai Electric Power Co., Ltd. (600021SS) with our professional-grade DCF Calculator! Adjust key assumptions, explore various scenarios, and evaluate how changes affect the valuation of Shanghai Electric Power Co., Ltd. (600021SS) – all within a single Excel template.
Discounted Cash Flow (DCF) - (USD MM)
| Year | AY1 2020 |
AY2 2021 |
AY3 2022 |
AY4 2023 |
AY5 2024 |
FY1 2025 |
FY2 2026 |
FY3 2027 |
FY4 2028 |
FY5 2029 |
|---|---|---|---|---|---|---|---|---|---|---|
| Revenue | 24,217.8 | 30,836.2 | 39,248.6 | 42,401.8 | 42,733.9 | 49,510.1 | 57,360.7 | 66,456.2 | 76,994.0 | 89,202.7 |
| Revenue Growth, % | 0 | 27.33 | 27.28 | 8.03 | 0.78329 | 15.86 | 15.86 | 15.86 | 15.86 | 15.86 |
| EBITDA | 8,933.8 | 7,287.6 | 11,219.4 | 13,082.3 | 13,873.8 | 15,093.3 | 17,486.6 | 20,259.4 | 23,471.9 | 27,193.7 |
| EBITDA, % | 36.89 | 23.63 | 28.59 | 30.85 | 32.47 | 30.49 | 30.49 | 30.49 | 30.49 | 30.49 |
| Depreciation | 4,180.6 | 4,762.8 | 5,712.8 | 6,462.0 | 6,801.9 | 7,765.2 | 8,996.5 | 10,423.0 | 12,075.8 | 13,990.6 |
| Depreciation, % | 17.26 | 15.45 | 14.56 | 15.24 | 15.92 | 15.68 | 15.68 | 15.68 | 15.68 | 15.68 |
| EBIT | 4,753.1 | 2,524.8 | 5,506.6 | 6,620.3 | 7,071.9 | 7,328.1 | 8,490.1 | 9,836.3 | 11,396.1 | 13,203.1 |
| EBIT, % | 19.63 | 8.19 | 14.03 | 15.61 | 16.55 | 14.8 | 14.8 | 14.8 | 14.8 | 14.8 |
| Total Cash | 5,796.5 | 5,888.6 | 7,468.1 | 6,772.0 | 5,911.1 | 9,096.2 | 10,538.6 | 12,209.7 | 14,145.7 | 16,388.7 |
| Total Cash, percent | .0 | .0 | .0 | .0 | .0 | .0 | .0 | .0 | .0 | .0 |
| Account Receivables | 10,757.5 | 14,468.1 | 15,648.6 | 20,086.8 | 27,342.2 | 24,018.8 | 27,827.3 | 32,239.8 | 37,352.0 | 43,274.8 |
| Account Receivables, % | 44.42 | 46.92 | 39.87 | 47.37 | 63.98 | 48.51 | 48.51 | 48.51 | 48.51 | 48.51 |
| Inventories | 338.1 | 1,296.4 | 1,244.4 | 1,028.7 | 1,047.6 | 1,351.4 | 1,565.7 | 1,814.0 | 2,101.6 | 2,434.9 |
| Inventories, % | 1.4 | 4.2 | 3.17 | 2.43 | 2.45 | 2.73 | 2.73 | 2.73 | 2.73 | 2.73 |
| Accounts Payable | 1,958.3 | 7,809.5 | 9,094.5 | 7,575.5 | 9,782.9 | 9,638.8 | 11,167.2 | 12,938.0 | 14,989.5 | 17,366.4 |
| Accounts Payable, % | 8.09 | 25.33 | 23.17 | 17.87 | 22.89 | 19.47 | 19.47 | 19.47 | 19.47 | 19.47 |
| Capital Expenditure | -14,522.2 | -11,533.2 | -8,632.5 | -8,066.7 | -13,239.3 | -16,770.6 | -19,429.9 | -22,510.8 | -26,080.3 | -30,215.8 |
| Capital Expenditure, % | -59.97 | -37.4 | -21.99 | -19.02 | -30.98 | -33.87 | -33.87 | -33.87 | -33.87 | -33.87 |
| Tax Rate, % | 60.63 | 60.63 | 60.63 | 60.63 | 60.63 | 60.63 | 60.63 | 60.63 | 60.63 | 60.63 |
| EBITAT | 1,690.0 | 4,861.4 | 719.6 | 2,394.4 | 2,784.5 | 3,285.4 | 3,806.3 | 4,409.9 | 5,109.2 | 5,919.3 |
| Depreciation | ||||||||||
| Changes in Account Receivables | ||||||||||
| Changes in Inventories | ||||||||||
| Changes in Accounts Payable | ||||||||||
| Capital Expenditure | ||||||||||
| UFCF | -17,788.8 | -726.7 | -2,043.6 | -4,951.8 | -8,719.8 | -2,844.5 | -9,121.5 | -10,567.9 | -12,243.6 | -14,185.1 |
| WACC, % | 3.55 | 4.95 | 3.06 | 3.57 | 3.64 | 3.75 | 3.75 | 3.75 | 3.75 | 3.75 |
| PV UFCF | ||||||||||
| SUM PV UFCF | -43,041.0 | |||||||||
| Long Term Growth Rate, % | 3.50 | |||||||||
| Free cash flow (T + 1) | -14,682 | |||||||||
| Terminal Value | -5,791,085 | |||||||||
| Present Terminal Value | -4,816,658 | |||||||||
| Enterprise Value | -4,859,699 | |||||||||
| Net Debt | 71,389 | |||||||||
| Equity Value | -4,931,088 | |||||||||
| Diluted Shares Outstanding, MM | 3,315 | |||||||||
| Equity Value Per Share | -1,487.54 |
Benefits You Will Receive
- Customizable Excel Template: An adaptable Excel-based DCF Calculator featuring pre-filled financial data for Shanghai Electric Power Co., Ltd. (600021SS).
- Authentic Data: Access to historical performance and forward-looking projections (highlighted in the yellow cells).
- Forecasting Flexibility: Adjust key assumptions such as revenue growth, EBITDA %, and WACC to suit your analysis.
- Instant Calculations: Quickly assess how changes in your inputs affect the valuation of Shanghai Electric Power Co., Ltd. (600021SS).
- Professional Resource: Designed for investors, CFOs, consultants, and financial analysts seeking insightful tools.
- User-Centric Design: Organized for clarity and simplicity, complemented by easy-to-follow instructions.
Core Features
- Customizable Forecast Inputs: Adjust essential metrics such as revenue growth, EBITDA margin, and capital expenditure levels.
- Instant DCF Valuation: Generates intrinsic value, NPV, and additional outputs with ease.
- High-Precision Accuracy: Leverages Shanghai Electric Power Co., Ltd.'s actual financial data for realistic valuation results.
- Simplified Scenario Analysis: Evaluate various assumptions and compare results effortlessly.
- Efficiency Booster: Remove the complexity of creating valuation models from the ground up.
How It Functions
- Download: Obtain the pre-prepared Excel file containing Shanghai Electric Power Co., Ltd.'s (600021SS) financial data.
- Customize: Tailor your forecasts, including revenue growth, EBITDA percentage, and WACC.
- Update Automatically: The intrinsic value and NPV calculations refresh in real-time.
- Test Scenarios: Generate various projections and immediately assess the results.
- Make Decisions: Leverage the valuation findings to inform your investment strategy.
Why Opt for This Calculator?
- User-Friendly: Tailored for both novices and seasoned professionals.
- Customizable Inputs: Adjust parameters easily to suit your analysis needs.
- Real-Time Updates: Observe immediate changes in Shanghai Electric Power Co., Ltd. (600021SS) valuation with input adjustments.
- Preloaded with Data: Comes with Shanghai Electric's actual financial information for swift evaluations.
- Relied Upon by Experts: Favored by investors and analysts for informed decision-making.
Who Can Benefit from This Product?
- Investors: Evaluate the valuation of Shanghai Electric Power Co., Ltd. (600021SS) before making stock transactions.
- CFOs and Financial Analysts: Enhance valuation workflows and validate financial forecasts.
- Startup Founders: Discover the valuation strategies used for established companies like Shanghai Electric Power Co., Ltd. (600021SS).
- Consultants: Provide clients with detailed and professional valuation reports.
- Students and Educators: Utilize real-world data for practicing and teaching valuation methodologies.
Contents of the Template
- Pre-Filled Data: Contains historical financials and projections for Shanghai Electric Power Co., Ltd. (600021SS).
- Discounted Cash Flow Model: An editable DCF valuation model with automatic calculation features.
- Weighted Average Cost of Capital (WACC): A dedicated worksheet for calculating WACC using custom inputs.
- Key Financial Ratios: Assess Shanghai Electric's profitability, efficiency, and leverage metrics.
- Customizable Inputs: Easily adjust revenue growth, margins, and tax rates.
- Clear Dashboard: Visual representations and tables summarizing essential valuation outcomes.
Disclaimer
All information, articles, and product details provided on this website are for general informational and educational purposes only. We do not claim any ownership over, nor do we intend to infringe upon, any trademarks, copyrights, logos, brand names, or other intellectual property mentioned or depicted on this site. Such intellectual property remains the property of its respective owners, and any references here are made solely for identification or informational purposes, without implying any affiliation, endorsement, or partnership.
We make no representations or warranties, express or implied, regarding the accuracy, completeness, or suitability of any content or products presented. Nothing on this website should be construed as legal, tax, investment, financial, medical, or other professional advice. In addition, no part of this site—including articles or product references—constitutes a solicitation, recommendation, endorsement, advertisement, or offer to buy or sell any securities, franchises, or other financial instruments, particularly in jurisdictions where such activity would be unlawful.
All content is of a general nature and may not address the specific circumstances of any individual or entity. It is not a substitute for professional advice or services. Any actions you take based on the information provided here are strictly at your own risk. You accept full responsibility for any decisions or outcomes arising from your use of this website and agree to release us from any liability in connection with your use of, or reliance upon, the content or products found herein.