
|
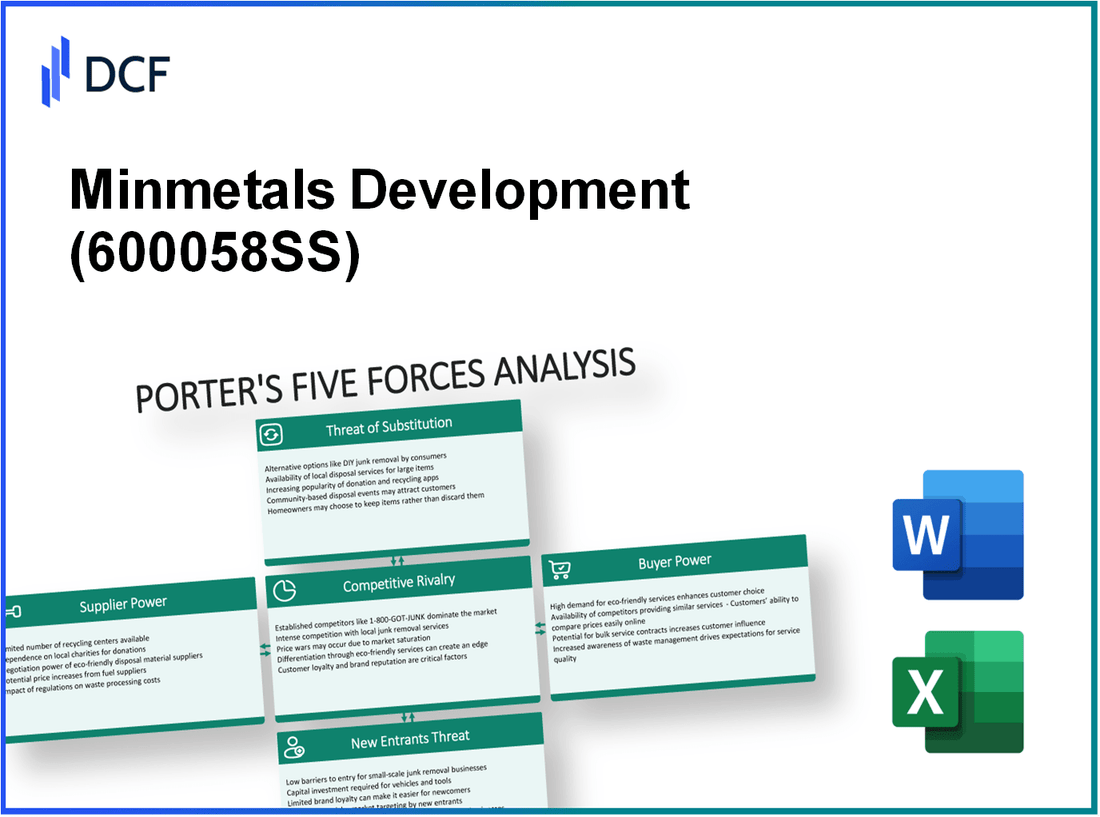
Minmetals Development Co., Ltd. (600058.SS): Porter's 5 Forces Analysis |
Fully Editable: Tailor To Your Needs In Excel Or Sheets
Professional Design: Trusted, Industry-Standard Templates
Investor-Approved Valuation Models
MAC/PC Compatible, Fully Unlocked
No Expertise Is Needed; Easy To Follow
Minmetals Development Co., Ltd. (600058.SS) Bundle
Understanding the dynamics of Minmetals Development Co., Ltd. through Michael Porter’s Five Forces Framework reveals the intricate dance between suppliers, customers, and competitors in the metal industry. As we delve into the bargaining powers, competitive rivalries, and market threats that shape this sector, you’ll discover the underlying factors influencing the company's strategic decisions and market positioning. Join us as we explore these critical components to grasp the full picture of Minmetals’ business landscape.
Minmetals Development Co., Ltd. - Porter's Five Forces: Bargaining power of suppliers
The bargaining power of suppliers is a crucial factor influencing operational costs and pricing strategy for Minmetals Development Co., Ltd. Understanding this dynamic helps in assessing the company's supply chain efficiency and market competitiveness.
Diverse supplier base
Minmetals Development Co., Ltd. has established a diverse supplier base that mitigates risk related to supplier dependency. The company works with over 1,000 suppliers across various categories including metals, minerals, and logistics. This broad supplier network allows for competitive pricing and supply alternatives.
Dependence on specialty materials
Although Minmetals benefits from a diverse supplier base, it also relies heavily on specialty materials for its operations. Approximately 30% of the raw materials procured by the company fall under specialized categories, such as rare earth metals, which have limited suppliers globally. This could increase supplier power in negotiations.
Potential for vertical integration
Minmetals has the potential for vertical integration to reduce supplier bargaining power. By investing in upstream operations, the company can produce some raw materials in-house. In 2022, Minmetals announced plans to invest CNY 5 billion in establishing new mining facilities aimed at securing critical resources, potentially reducing reliance on external suppliers.
Influence of global commodity prices
The bargaining power of suppliers is also affected by the influence of global commodity prices. For instance, in 2023, the price of copper has fluctuated between $3.70 and $4.60 per pound. Suppliers may increase their prices in alignment with these trends, impacting Minmetals' operational costs directly.
Limited availability of critical resources
Minmetals faces challenges due to the limited availability of critical resources. Key raw materials such as lithium and cobalt have seen demand surge, with global prices increasing by approximately 150% in the past two years. The concentration of these resources among a few suppliers enhances their bargaining power, which could affect Minmetals' procurement strategies.
| Supplier Category | Percentage of Total Procurement | Average Supplier Price Increase (2023) |
|---|---|---|
| Metals | 45% | 10% |
| Minerals | 25% | 15% |
| Logistics | 20% | 8% |
| Specialty Materials | 10% | 20% |
The dynamics of the supplier power for Minmetals Development Co., Ltd. illustrate a complex landscape where the company must navigate varied supply dependencies and market conditions. By leveraging a diverse supplier base while actively exploring vertical integration opportunities, Minmetals aims to sustain its competitive edge amidst growing supplier influence.
Minmetals Development Co., Ltd. - Porter's Five Forces: Bargaining power of customers
The bargaining power of customers in the context of Minmetals Development Co., Ltd. is significantly influenced by several factors that collectively shape the dynamics of buyer influence within the industry.
Large Industrial and Construction Customer Base
Minmetals caters to a diverse clientele, predominantly within industrial and construction sectors. Major customers include corporations like China State Construction Engineering Corporation and China National Petroleum Corporation. In 2022, the industrial sector accounted for approximately 60% of the company’s revenue, translating to roughly RMB 15 billion in sales.
Price Sensitivity Due to Commodity Nature
The nature of the commodities offered by Minmetals—primarily metals and minerals—shows high price sensitivity. In 2023, the average price per ton of copper fluctuated between RMB 60,000 and RMB 70,000, varying with market conditions and affecting buyer decisions. When commodity prices fall, customers often pressure suppliers to reduce costs, enhancing their bargaining power.
Demand for Customization and Value-Added Services
Customers increasingly seek customized solutions and value-added services from suppliers. A recent survey indicated that approximately 75% of key customers expressed a willingness to pay a premium for tailored services that meet specific needs. This demand creates leverage for customers as suppliers must focus on innovation and quality to maintain relationships.
Long-Term Contracts Reduce Switching
Minmetals Development has established numerous long-term contracts with major clients, which mitigates the risk of customer switching. As of end-2022, around 40% of its sales were secured through long-term contracts spanning up to five years. This contractual stability provides a buffer against price negotiations and enhances customer loyalty.
Influence from Large Corporate Buyers
Large corporate buyers exert considerable influence on pricing and service terms. In 2022, the top five customers constituted approximately 50% of total sales. Their purchasing volume gives them leverage in negotiations, often resulting in bulk pricing discounts and greater influence over service conditions.
| Factor | Details | Impact |
|---|---|---|
| Customer Base | Comprises 60% industrial and construction | High concentration of influence |
| Price Sensitivity | Average copper price: RMB 60,000-70,000 | Increased bargaining power with price fluctuations |
| Customization Demand | 75% willing to pay for tailored services | Drives innovation and service enhancement |
| Long-Term Contracts | 40% of sales through contracts | Stability in customer relationships |
| Corporate Buyer Influence | Top 5 customers = 50% of total sales | Leverage in price negotiations |
The bargaining power of customers in Minmetals Development Co., Ltd. reflects a complex interplay of industry dynamics, customer expectations, and market conditions, which significantly shape the competitive landscape of the company.
Minmetals Development Co., Ltd. - Porter's Five Forces: Competitive rivalry
The competitive landscape for Minmetals Development Co., Ltd. is characterized by various critical factors. The presence of numerous domestic and international competitors significantly shapes the market dynamics.
Presence of numerous domestic and international competitors
Minmetals faces competition from both local players and foreign companies. As of 2023, the global metals and mining market is projected to reach approximately $1.3 trillion by 2026, growing at a CAGR of 3.5%. Key competitors include companies like China Minmetals Corporation, Jiangxi Copper Corporation, and Glencore.
High fixed costs intensifying competition
High fixed costs are a common trend in the mining industry, driving companies to maximize production to maintain profitability. For instance, the average fixed costs for mining operations can range from $100 million to $300 million, varying by project size and location. This necessitates continuous competitive pressure as firms fight for market share.
Low product differentiation
In the metals industry, many products are undifferentiated commodities. For example, copper prices as of October 2023 stood at approximately $3.60 per pound. This price uniformity leads to intense price competition among key players. In 2022, the average profit margin for copper mining firms hovered around 15%, indicating the fiercely competitive nature of the market.
Importance of technological advancements
Technological innovations play a vital role in maintaining competitiveness. Minmetals, for instance, invested over $50 million in R&D in 2022 to enhance production efficiencies and sustainability practices. The global mining technology market is expected to reach $28 billion by 2025, with a focus on automation and data analytics, further highlighting the significance of technology in competitive positioning.
Strategic alliances shaping market dynamics
Strategic alliances are increasingly pivotal in the competitive arena. In 2023, Minmetals entered a collaboration with Vale S.A. to enhance operational synergies, targeting a reduction in production costs by up to 20%. Such alliances allow companies to share resources and bolster market positions against competitors.
| Competitor | Market Share (%) | Annual Revenue (USD Billions) | Production Capacity (Tons/Year) |
|---|---|---|---|
| China Minmetals Corporation | 12% | 60 | 10 million |
| Jiangxi Copper Corporation | 8% | 30 | 1.5 million |
| Glencore | 10% | 215 | 5 million |
| Freeport-McMoRan | 7% | 24 | 4 million |
Understanding these dynamics allows stakeholders to appreciate the competitive landscape in which Minmetals Development Co., Ltd. operates, highlighting the ongoing challenges and strategic considerations in this sector.
Minmetals Development Co., Ltd. - Porter's Five Forces: Threat of substitutes
The threat of substitutes for Minmetals Development Co., Ltd. is influenced by various factors that can impact the materials market.
Availability of alternative materials like plastics and composites
As of 2023, the global plastics market was valued at approximately $600 billion, with significant growth projected due to innovations in polymer technologies. Composites also offer formidable competition, with the market expected to reach $150 billion by 2024. These materials are increasingly used in automotive and aerospace applications, often substituting traditional metals.
Price performance ratio of substitutes
The price of aluminum, a major metal used by Minmetals, was around $2,200 per metric ton in Q1 2023. In contrast, high-performance plastics can be produced at costs ranging between $1,500 to $2,000 per metric ton. This lower price range, combined with comparable performance characteristics, enhances the threat from substitutes.
Technological innovations reducing reliance on metals
Technological advancements have led to the development of advanced polymers that can replicate the strength and durability of metals. For instance, carbon fiber composites, offering high strength-to-weight ratios, have gained traction in industries like automotive and aviation. The global carbon fiber market is expected to grow from $3.2 billion in 2022 to $5.6 billion by 2027.
Customer preference trends towards sustainable options
Consumer preference is increasingly shifting towards sustainable materials. A survey conducted in 2022 revealed that 75% of consumers consider sustainability when making purchasing decisions, significantly impacting demand for eco-friendly materials over traditional metals. This trend reflects a broader commitment across industries to reduce carbon footprints and environmental impact.
Changes in regulatory environments promoting alternative materials
Governments worldwide are implementing regulations that promote the use of alternative materials. For example, the European Union's Circular Economy Action Plan encourages the substitution of metals with sustainable materials, impacting import and export dynamics in the metals market. As of 2023, various subsidies were launched for the development and use of biodegradable plastics, with a budget allocation of approximately $500 million to encourage innovation in this sector.
| Alternative Material | Global Market Value (2023) | Price per Metric Ton | Projected Growth Rate (2024) |
|---|---|---|---|
| Plastics | $600 billion | $1,500 - $2,000 | 4% CAGR |
| Composites | $150 billion | $2,500 - $3,000 | 5% CAGR |
| Carbon Fiber | $3.2 billion | $20,000 - $30,000 | 8% CAGR |
In summary, the threat of substitutes for Minmetals Development Co., Ltd. is substantial due to the rising availability of alternative materials, competitive pricing, technological innovations, evolving customer preferences, and supportive regulatory frameworks. Each of these aspects plays a critical role in shaping market dynamics and influencing strategic decisions within the company.
Minmetals Development Co., Ltd. - Porter's Five Forces: Threat of new entrants
The threat of new entrants in the mining and metals industry is characterized by several critical factors that influence market dynamics.
High capital investment requirements
The mining industry necessitates substantial capital investments, often exceeding $1 billion for major mining projects. For instance, in 2022, Minmetals Development Co., Ltd. reported capital expenditures of approximately $1.2 billion to enhance its production capabilities and explore new mining opportunities. Such high costs create a significant barrier to entry for potential newcomers.
Established supply chain networks
Existing players like Minmetals leverage extensive supply chain networks that have been optimized over years. The company operates over 30 mining projects globally, which facilitates established contracts with suppliers and distributors. New entrants face difficulties in negotiating similar contracts, leading to potential cost disadvantages.
Economies of scale advantages for existing players
Minmetals, with its large-scale operations, enjoys economies of scale that lower average costs. For example, the company’s production volume reached 5 million tons of various metals in 2022, allowing it to maintain a cost per ton that is 20% lower than smaller competitors. This cost efficiency further deters new entrants who cannot match these production levels.
Regulatory and environmental compliance barriers
The mining sector is heavily regulated, with compliance costs often reaching up to $200 million for new entrants seeking permits. Minmetals Development Co., Ltd. has navigated this complex regulatory landscape, having invested over $150 million in environmental compliance measures in recent years. Such substantial investment in regulatory adherence creates a high entry barrier for new competitors.
Brand loyalty and established reputation of incumbents
Minmetals benefits from a strong brand reputation, established over decades. According to a 2023 market study, it ranked in the top 5 among mining companies in brand recognition and customer loyalty. Market surveys indicate that 75% of industry clients prefer established brands due to trust and reliability, making it challenging for new entrants to attract customers.
| Factor | Data |
|---|---|
| Capital Investment for Major Projects | $1 billion+ |
| Minmetals Capital Expenditures (2022) | $1.2 billion |
| Average Cost Advantage Percentage | 20% |
| Production Volume (2022) | 5 million tons |
| Average Compliance Costs for New Entrants | $200 million |
| Minmetals Environmental Compliance Investment | $150 million |
| Brand Recognition Rank | Top 5 |
| Client Preferability for Established Brands | 75% |
These factors collectively indicate a robust barrier to entry for new competitors in the mining sector, where Minmetals Development Co., Ltd. operates. The combination of high capital requirements, established networks, economies of scale, regulatory challenges, and brand loyalty fortifies the company's competitive position against potential market entrants.
Understanding the dynamics of Minmetals Development Co., Ltd. through Porter's Five Forces reveals the complex landscape it navigates in the metal industry, from the strong bargaining power of suppliers and customers to the ever-looming threat of substitutes and new entrants. This analysis highlights the strategic challenges and opportunities that Minmetals faces, guiding stakeholders to make informed decisions in a competitive market that is constantly evolving.
[right_small]Disclaimer
All information, articles, and product details provided on this website are for general informational and educational purposes only. We do not claim any ownership over, nor do we intend to infringe upon, any trademarks, copyrights, logos, brand names, or other intellectual property mentioned or depicted on this site. Such intellectual property remains the property of its respective owners, and any references here are made solely for identification or informational purposes, without implying any affiliation, endorsement, or partnership.
We make no representations or warranties, express or implied, regarding the accuracy, completeness, or suitability of any content or products presented. Nothing on this website should be construed as legal, tax, investment, financial, medical, or other professional advice. In addition, no part of this site—including articles or product references—constitutes a solicitation, recommendation, endorsement, advertisement, or offer to buy or sell any securities, franchises, or other financial instruments, particularly in jurisdictions where such activity would be unlawful.
All content is of a general nature and may not address the specific circumstances of any individual or entity. It is not a substitute for professional advice or services. Any actions you take based on the information provided here are strictly at your own risk. You accept full responsibility for any decisions or outcomes arising from your use of this website and agree to release us from any liability in connection with your use of, or reliance upon, the content or products found herein.