
|
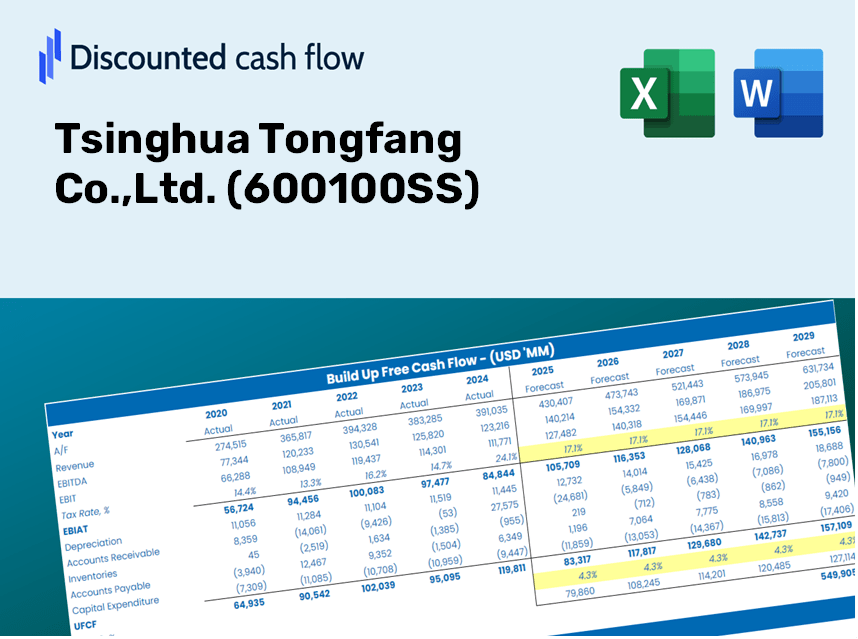
Tsinghua Tongfang Co.,Ltd. (600100.SS) DCF Valuation |
Fully Editable: Tailor To Your Needs In Excel Or Sheets
Professional Design: Trusted, Industry-Standard Templates
Investor-Approved Valuation Models
MAC/PC Compatible, Fully Unlocked
No Expertise Is Needed; Easy To Follow
Tsinghua Tongfang Co.,Ltd. (600100.SS) Bundle
Explore the financial prospects of Tsinghua Tongfang Co., Ltd. with our user-friendly DCF Calculator! Enter your assumptions for growth, margins, and costs to calculate the intrinsic value of Tsinghua Tongfang Co., Ltd. (600100SS) and refine your investment approach.
What You Will Receive
- Customizable Excel Template: An entirely adaptable Excel-based DCF Calculator featuring pre-loaded financials for Tsinghua Tongfang Co., Ltd. (600100SS).
- Real-World Metrics: Access to historical data and forward-looking projections (displayed in the highlighted cells).
- Flexible Forecasting: Modify key assumptions such as revenue growth, EBITDA margin, and WACC.
- Automated Calculations: Instantly observe how your inputs influence the valuation of Tsinghua Tongfang Co., Ltd. (600100SS).
- Professional Solution: Designed for investors, CFOs, consultants, and financial analysts.
- Intuitive Interface: Organized for clarity and simplicity, complete with detailed instructions.
Key Features
- 🔍 Real-Life Tsinghua Tongfang Financials: Pre-filled historical and projected data for Tsinghua Tongfang Co., Ltd. (600100SS).
- ✏️ Fully Customizable Inputs: Adjust all key parameters (yellow cells) such as WACC, growth %, and tax rates.
- 📊 Professional DCF Valuation: Integrated formulas calculate Tsinghua Tongfang’s intrinsic value using the Discounted Cash Flow method.
- ⚡ Instant Results: Visualize Tsinghua Tongfang’s valuation immediately after adjustments.
- Scenario Analysis: Explore and compare results for various financial assumptions side-by-side.
How It Functions
- Download the Template: Gain immediate access to the Excel-based Tsinghua Tongfang Co., Ltd. (600100SS) DCF Calculator.
- Input Your Assumptions: Modify the yellow-highlighted cells for parameters such as growth rates, WACC, margins, and more.
- Instant Calculations: The model automatically recalculates Tsinghua Tongfang's intrinsic value.
- Test Scenarios: Experiment with various assumptions to assess potential changes in valuation.
- Analyze and Decide: Utilize the outcomes to inform your investment or financial analysis.
Why Opt for This Calculator for Tsinghua Tongfang Co.,Ltd. (600100SS)?
- All-in-One Solution: Combines DCF, WACC, and financial ratio analyses for comprehensive evaluations.
- Flexible Configuration: Modify the yellow-highlighted cells to explore different financial scenarios.
- In-Depth Analysis: Automatically computes the intrinsic value and Net Present Value for Tsinghua Tongfang.
- Ready-to-Use Data: Historical and forecast data provide reliable foundations for analysis.
- Expert Quality: Perfect for financial analysts, investors, and business consultants focused on Tsinghua Tongfang Co.,Ltd.
Who Can Benefit from This Product?
- Individual Investors: Make informed choices regarding the purchase or sale of Tsinghua Tongfang Co., Ltd. (600100SS) stock.
- Financial Analysts: Enhance valuation procedures with ready-to-implement financial models tailored for Tsinghua Tongfang Co., Ltd. (600100SS).
- Consultants: Provide clients with precise and timely valuation insights for Tsinghua Tongfang Co., Ltd. (600100SS).
- Business Owners: Gain insight into how large enterprises like Tsinghua Tongfang Co., Ltd. (600100SS) are valued to inform your own business strategies.
- Finance Students: Acquire valuation skills through the analysis of real-world data and case studies related to Tsinghua Tongfang Co., Ltd. (600100SS).
Contents of the Template
- Pre-Filled DCF Model: Tsinghua Tongfang Co., Ltd.’s financial data preloaded for immediate application.
- WACC Calculator: Comprehensive calculations for the Weighted Average Cost of Capital.
- Financial Ratios: Analyze Tsinghua Tongfang Co., Ltd.’s profitability, leverage, and efficiency metrics.
- Editable Inputs: Modify assumptions like growth rates, profit margins, and CAPEX to suit your specific scenarios.
- Financial Statements: Access annual and quarterly reports for thorough analysis.
- Interactive Dashboard: Effortlessly visualize essential valuation metrics and outcomes.
Disclaimer
All information, articles, and product details provided on this website are for general informational and educational purposes only. We do not claim any ownership over, nor do we intend to infringe upon, any trademarks, copyrights, logos, brand names, or other intellectual property mentioned or depicted on this site. Such intellectual property remains the property of its respective owners, and any references here are made solely for identification or informational purposes, without implying any affiliation, endorsement, or partnership.
We make no representations or warranties, express or implied, regarding the accuracy, completeness, or suitability of any content or products presented. Nothing on this website should be construed as legal, tax, investment, financial, medical, or other professional advice. In addition, no part of this site—including articles or product references—constitutes a solicitation, recommendation, endorsement, advertisement, or offer to buy or sell any securities, franchises, or other financial instruments, particularly in jurisdictions where such activity would be unlawful.
All content is of a general nature and may not address the specific circumstances of any individual or entity. It is not a substitute for professional advice or services. Any actions you take based on the information provided here are strictly at your own risk. You accept full responsibility for any decisions or outcomes arising from your use of this website and agree to release us from any liability in connection with your use of, or reliance upon, the content or products found herein.