
|
China Spacesat Co.,Ltd. (600118.SS) DCF Valuation |
Fully Editable: Tailor To Your Needs In Excel Or Sheets
Professional Design: Trusted, Industry-Standard Templates
Investor-Approved Valuation Models
MAC/PC Compatible, Fully Unlocked
No Expertise Is Needed; Easy To Follow
China Spacesat Co.,Ltd. (600118.SS) Bundle
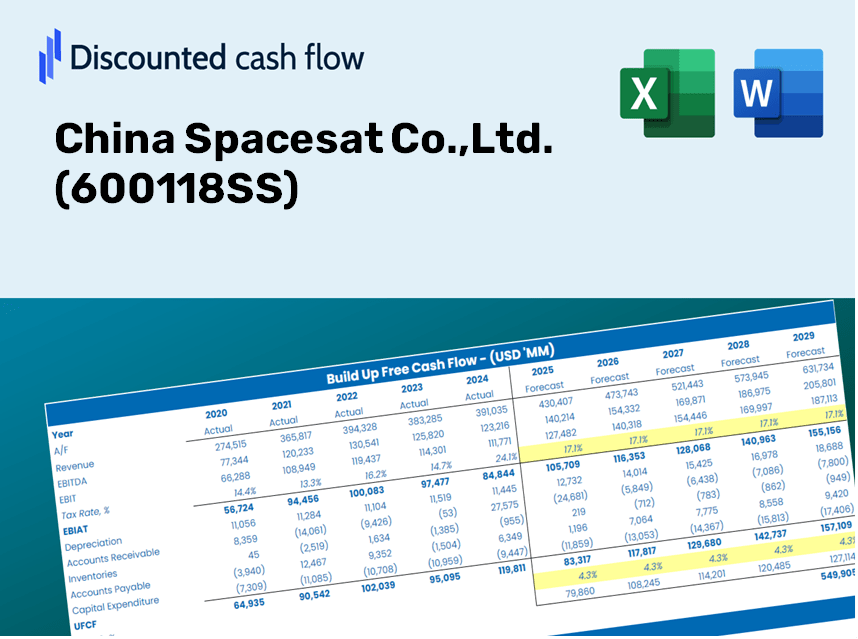
Gain insights into your China Spacesat Co., Ltd. (600118SS) valuation analysis using our cutting-edge DCF Calculator! This Excel template comes preloaded with authentic (600118SS) data, allowing you to adjust forecasts and assumptions to accurately determine the intrinsic value of China Spacesat Co., Ltd.
Discounted Cash Flow (DCF) - (USD MM)
| Year | AY1 2020 |
AY2 2021 |
AY3 2022 |
AY4 2023 |
AY5 2024 |
FY1 2025 |
FY2 2026 |
FY3 2027 |
FY4 2028 |
FY5 2029 |
|---|---|---|---|---|---|---|---|---|---|---|
| Revenue | 7,007.4 | 7,058.9 | 8,242.3 | 6,881.2 | 5,156.5 | 4,846.1 | 4,554.4 | 4,280.2 | 4,022.6 | 3,780.4 |
| Revenue Growth, % | 0 | 0.7353 | 16.76 | -16.51 | -25.06 | -6.02 | -6.02 | -6.02 | -6.02 | -6.02 |
| EBITDA | 746.4 | 757.8 | 699.5 | 499.1 | 349.9 | 425.6 | 400.0 | 375.9 | 353.3 | 332.0 |
| EBITDA, % | 10.65 | 10.73 | 8.49 | 7.25 | 6.79 | 8.78 | 8.78 | 8.78 | 8.78 | 8.78 |
| Depreciation | 259.4 | 390.7 | 360.9 | 320.2 | 391.0 | 250.5 | 235.5 | 221.3 | 208.0 | 195.5 |
| Depreciation, % | 3.7 | 5.54 | 4.38 | 4.65 | 7.58 | 5.17 | 5.17 | 5.17 | 5.17 | 5.17 |
| EBIT | 487.0 | 367.1 | 338.6 | 179.0 | -41.0 | 175.1 | 164.5 | 154.6 | 145.3 | 136.6 |
| EBIT, % | 6.95 | 5.2 | 4.11 | 2.6 | -0.7957 | 3.61 | 3.61 | 3.61 | 3.61 | 3.61 |
| Total Cash | 2,119.4 | 3,613.0 | 4,045.4 | 2,443.6 | 1,758.1 | 1,939.6 | 1,822.8 | 1,713.1 | 1,610.0 | 1,513.0 |
| Total Cash, percent | .0 | .0 | .0 | .0 | .0 | .0 | .0 | .0 | .0 | .0 |
| Account Receivables | 3,716.9 | 3,043.6 | 3,585.6 | 5,083.6 | 5,174.7 | 3,038.9 | 2,856.0 | 2,684.0 | 2,522.5 | 2,370.6 |
| Account Receivables, % | 53.04 | 43.12 | 43.5 | 73.88 | 100.35 | 62.71 | 62.71 | 62.71 | 62.71 | 62.71 |
| Inventories | 2,100.7 | 2,576.1 | 2,005.4 | 1,881.0 | 2,241.7 | 1,566.4 | 1,472.1 | 1,383.5 | 1,300.2 | 1,221.9 |
| Inventories, % | 29.98 | 36.49 | 24.33 | 27.34 | 43.47 | 32.32 | 32.32 | 32.32 | 32.32 | 32.32 |
| Accounts Payable | 2,816.6 | 3,266.0 | 3,221.4 | 3,295.5 | 2,711.0 | 2,190.6 | 2,058.7 | 1,934.8 | 1,818.3 | 1,708.9 |
| Accounts Payable, % | 40.19 | 46.27 | 39.08 | 47.89 | 52.58 | 45.2 | 45.2 | 45.2 | 45.2 | 45.2 |
| Capital Expenditure | -292.5 | -269.2 | -172.4 | -218.9 | -206.6 | -167.4 | -157.3 | -147.8 | -138.9 | -130.6 |
| Capital Expenditure, % | -4.17 | -3.81 | -2.09 | -3.18 | -4.01 | -3.45 | -3.45 | -3.45 | -3.45 | -3.45 |
| Tax Rate, % | 146.43 | 146.43 | 146.43 | 146.43 | 146.43 | 146.43 | 146.43 | 146.43 | 146.43 | 146.43 |
| EBITAT | 360.9 | 344.6 | 286.2 | 170.2 | 19.1 | 121.7 | 114.4 | 107.5 | 101.0 | 94.9 |
| Depreciation | ||||||||||
| Changes in Account Receivables | ||||||||||
| Changes in Inventories | ||||||||||
| Changes in Accounts Payable | ||||||||||
| Capital Expenditure | ||||||||||
| UFCF | -2,673.2 | 1,113.4 | 458.8 | -1,028.0 | -832.8 | 2,495.6 | 337.9 | 317.6 | 298.5 | 280.5 |
| WACC, % | 5.31 | 5.32 | 5.31 | 5.32 | 5.28 | 5.31 | 5.31 | 5.31 | 5.31 | 5.31 |
| PV UFCF | ||||||||||
| SUM PV UFCF | 3,405.7 | |||||||||
| Long Term Growth Rate, % | 3.00 | |||||||||
| Free cash flow (T + 1) | 289 | |||||||||
| Terminal Value | 12,521 | |||||||||
| Present Terminal Value | 9,668 | |||||||||
| Enterprise Value | 13,074 | |||||||||
| Net Debt | -1,160 | |||||||||
| Equity Value | 14,234 | |||||||||
| Diluted Shares Outstanding, MM | 1,396 | |||||||||
| Equity Value Per Share | 10.20 |
Benefits You Will Receive
- Comprehensive Financial Model: China's actual data allows for an accurate DCF valuation for China Spacesat Co., Ltd. (600118SS).
- Full Forecast Customization: Adjust key variables such as revenue growth, profit margins, WACC, and other essential factors.
- Real-Time Calculations: Automatic updates provide immediate results as you modify inputs.
- Professionally Designed Template: A polished Excel file tailored for high-quality valuation processes.
- Flexible and Reusable: Designed for adaptability, enabling repeated use for in-depth financial projections.
Key Features
- 🔍 Real-Life (600118SS) Financials: Pre-filled historical and projected data for China Spacesat Co., Ltd.
- ✏️ Fully Customizable Inputs: Modify all essential parameters (yellow cells) such as WACC, growth %, and tax rates.
- 📊 Professional DCF Valuation: In-built formulas determine China Spacesat’s intrinsic value through the Discounted Cash Flow method.
- ⚡ Instant Results: Visualize China Spacesat’s valuation immediately after making adjustments.
- Scenario Analysis: Evaluate and compare outcomes for different financial assumptions side-by-side.
How It Works
- Download: Get the ready-to-use Excel file containing China Spacesat Co., Ltd.'s (600118SS) financial data.
- Customize: Modify forecasts such as revenue growth, EBITDA %, and WACC according to your analysis.
- Update Automatically: View real-time updates for intrinsic value and NPV calculations.
- Test Scenarios: Build various financial projections and instantly compare their outcomes.
- Make Decisions: Leverage the valuation insights to inform your investment strategy.
Why Choose Our Services at China Spacesat Co., Ltd. (600118SS)?
- Precision: Utilize accurate data derived from China's satellite industry.
- Versatility: Tailored for clients to explore and adjust parameters as needed.
- Efficiency: Eliminate the complexities of starting from the ground up.
- Expertise: Crafted with the insights and standards expected by industry leaders.
- Accessibility: Intuitive design that accommodates users with various levels of technical knowledge.
Who Should Utilize This Product?
- Investors: Accurately assess the fair value of China Spacesat Co., Ltd. (600118SS) before making investment choices.
- CFOs: Utilize a professional-level DCF model for financial reporting and analysis specific to China Spacesat Co., Ltd. (600118SS).
- Consultants: Easily modify the template for valuation reports tailored to clients interested in China Spacesat Co., Ltd. (600118SS).
- Entrepreneurs: Obtain valuable insights into financial modeling practices of leading companies like China Spacesat Co., Ltd. (600118SS).
- Educators: Employ it as a teaching resource to illustrate valuation techniques related to China Spacesat Co., Ltd. (600118SS).
Contents of the Template
- Operating and Balance Sheet Data: Pre-filled historical data and forecasts for China Spacesat Co., Ltd. (600118SS), including revenue, EBITDA, EBIT, and capital expenditures.
- WACC Calculation: A dedicated sheet for the Weighted Average Cost of Capital (WACC), featuring parameters such as Beta, risk-free rate, and share price.
- DCF Valuation (Unlevered and Levered): Editable Discounted Cash Flow models that display intrinsic value with comprehensive calculations.
- Financial Statements: Pre-loaded annual and quarterly financial statements to aid in analysis.
- Key Ratios: Includes profitability, leverage, and efficiency ratios for China Spacesat Co., Ltd. (600118SS).
- Dashboard and Charts: A visual summary of valuation outputs and assumptions for easy result analysis.
Disclaimer
All information, articles, and product details provided on this website are for general informational and educational purposes only. We do not claim any ownership over, nor do we intend to infringe upon, any trademarks, copyrights, logos, brand names, or other intellectual property mentioned or depicted on this site. Such intellectual property remains the property of its respective owners, and any references here are made solely for identification or informational purposes, without implying any affiliation, endorsement, or partnership.
We make no representations or warranties, express or implied, regarding the accuracy, completeness, or suitability of any content or products presented. Nothing on this website should be construed as legal, tax, investment, financial, medical, or other professional advice. In addition, no part of this site—including articles or product references—constitutes a solicitation, recommendation, endorsement, advertisement, or offer to buy or sell any securities, franchises, or other financial instruments, particularly in jurisdictions where such activity would be unlawful.
All content is of a general nature and may not address the specific circumstances of any individual or entity. It is not a substitute for professional advice or services. Any actions you take based on the information provided here are strictly at your own risk. You accept full responsibility for any decisions or outcomes arising from your use of this website and agree to release us from any liability in connection with your use of, or reliance upon, the content or products found herein.