
|
Chongqing Taiji Industry Co.,Ltd (600129.SS) DCF Valuation |
Fully Editable: Tailor To Your Needs In Excel Or Sheets
Professional Design: Trusted, Industry-Standard Templates
Investor-Approved Valuation Models
MAC/PC Compatible, Fully Unlocked
No Expertise Is Needed; Easy To Follow
Chongqing Taiji Industry(Group) Co.,Ltd (600129.SS) Bundle
Whether you’re an investor or analyst, this (600129SS) DCF Calculator is your ultimate tool for accurate valuation. Preloaded with real data from Chongqing Taiji Industry (Group) Co., Ltd, you can adjust forecasts and observe the effects in real-time.
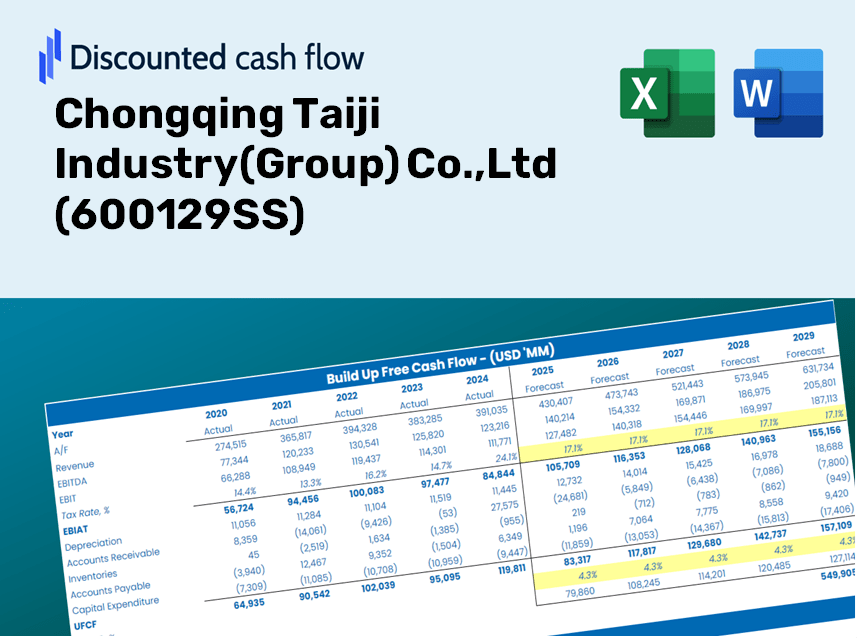
Discounted Cash Flow (DCF) - (USD MM)
| Year | AY1 2020 |
AY2 2021 |
AY3 2022 |
AY4 2023 |
AY5 2024 |
FY1 2025 |
FY2 2026 |
FY3 2027 |
FY4 2028 |
FY5 2029 |
|---|---|---|---|---|---|---|---|---|---|---|
| Revenue | 11,207.8 | 12,149.4 | 14,127.4 | 15,622.6 | 12,386.0 | 12,836.5 | 13,303.4 | 13,787.2 | 14,288.7 | 14,808.4 |
| Revenue Growth, % | 0 | 8.4 | 16.28 | 10.58 | -20.72 | 3.64 | 3.64 | 3.64 | 3.64 | 3.64 |
| EBITDA | 92.6 | 58.8 | 973.9 | 1,441.5 | 757.6 | 604.5 | 626.5 | 649.3 | 672.9 | 697.4 |
| EBITDA, % | 0.82597 | 0.48428 | 6.89 | 9.23 | 6.12 | 4.71 | 4.71 | 4.71 | 4.71 | 4.71 |
| Depreciation | 276.3 | 285.8 | 317.9 | 338.5 | 334.4 | 306.4 | 317.5 | 329.1 | 341.0 | 353.4 |
| Depreciation, % | 2.47 | 2.35 | 2.25 | 2.17 | 2.7 | 2.39 | 2.39 | 2.39 | 2.39 | 2.39 |
| EBIT | -183.7 | -227.0 | 656.0 | 1,103.1 | 423.2 | 298.2 | 309.0 | 320.2 | 331.9 | 344.0 |
| EBIT, % | -1.64 | -1.87 | 4.64 | 7.06 | 3.42 | 2.32 | 2.32 | 2.32 | 2.32 | 2.32 |
| Total Cash | 2,382.6 | 1,863.2 | 2,612.1 | 2,100.9 | 953.1 | 1,957.0 | 2,028.1 | 2,101.9 | 2,178.4 | 2,257.6 |
| Total Cash, percent | .0 | .0 | .0 | .0 | .0 | .0 | .0 | .0 | .0 | .0 |
| Account Receivables | 2,991.0 | 2,290.2 | 2,847.3 | 2,300.0 | 2,644.9 | 2,612.7 | 2,707.7 | 2,806.2 | 2,908.3 | 3,014.0 |
| Account Receivables, % | 26.69 | 18.85 | 20.15 | 14.72 | 21.35 | 20.35 | 20.35 | 20.35 | 20.35 | 20.35 |
| Inventories | 2,569.8 | 2,279.7 | 2,170.7 | 2,690.6 | 2,726.7 | 2,472.2 | 2,562.1 | 2,655.3 | 2,751.9 | 2,851.9 |
| Inventories, % | 22.93 | 18.76 | 15.37 | 17.22 | 22.01 | 19.26 | 19.26 | 19.26 | 19.26 | 19.26 |
| Accounts Payable | 3,592.4 | 2,446.2 | 1,998.4 | 2,042.6 | 1,852.0 | 2,422.5 | 2,510.6 | 2,601.9 | 2,696.6 | 2,794.6 |
| Accounts Payable, % | 32.05 | 20.13 | 14.15 | 13.07 | 14.95 | 18.87 | 18.87 | 18.87 | 18.87 | 18.87 |
| Capital Expenditure | -801.6 | -500.1 | -530.1 | -835.6 | -831.7 | -695.4 | -720.6 | -746.9 | -774.0 | -802.2 |
| Capital Expenditure, % | -7.15 | -4.12 | -3.75 | -5.35 | -6.72 | -5.42 | -5.42 | -5.42 | -5.42 | -5.42 |
| Tax Rate, % | 91.77 | 91.77 | 91.77 | 91.77 | 91.77 | 91.77 | 91.77 | 91.77 | 91.77 | 91.77 |
| EBITAT | -79.5 | -240.3 | 515.8 | 883.3 | 34.8 | 185.0 | 191.7 | 198.7 | 205.9 | 213.4 |
| Depreciation | ||||||||||
| Changes in Account Receivables | ||||||||||
| Changes in Inventories | ||||||||||
| Changes in Accounts Payable | ||||||||||
| Capital Expenditure | ||||||||||
| UFCF | -2,573.2 | -609.9 | -592.3 | 457.7 | -1,034.2 | 653.3 | -308.2 | -319.5 | -331.1 | -343.1 |
| WACC, % | 4.5 | 5.08 | 4.86 | 4.87 | 4.14 | 4.69 | 4.69 | 4.69 | 4.69 | 4.69 |
| PV UFCF | ||||||||||
| SUM PV UFCF | -484.1 | |||||||||
| Long Term Growth Rate, % | 3.50 | |||||||||
| Free cash flow (T + 1) | -355 | |||||||||
| Terminal Value | -29,895 | |||||||||
| Present Terminal Value | -23,775 | |||||||||
| Enterprise Value | -24,259 | |||||||||
| Net Debt | 4,013 | |||||||||
| Equity Value | -28,272 | |||||||||
| Diluted Shares Outstanding, MM | 557 | |||||||||
| Equity Value Per Share | -50.77 |
What You Will Receive
- Authentic 600129SS Financials: Offers historical and projected data to ensure precise valuation.
- Customizable Inputs: Adjust WACC, tax rates, revenue growth, and capital expenditures as needed.
- Automated Calculations: Intrinsic value and NPV are updated in real-time.
- Scenario Analysis: Evaluate various scenarios to assess Chongqing Taiji Industry(Group) Co., Ltd's future performance.
- User-Friendly Interface: Designed for professionals while remaining approachable for newcomers.
Key Features
- Comprehensive 600129SS Data: Pre-loaded with Chongqing Taiji Industry's historical financial data and future growth projections.
- Fully Adjustable Parameters: Modify revenue growth rates, profit margins, WACC, tax rates, and capital expenditure figures.
- Interactive Valuation Model: Automatic recalculations of Net Present Value (NPV) and intrinsic value based on your adjustments.
- Scenario Analysis: Develop various forecast scenarios to explore different valuation possibilities.
- Intuitive Interface: Clean, organized layout designed for both seasoned professionals and newcomers.
How It Operates
- Download: Obtain the pre-built Excel file containing Chongqing Taiji Industry(Group) Co., Ltd’s financial data.
- Customize: Modify projections, such as revenue growth, EBITDA %, and WACC to fit your analysis.
- Update Automatically: The calculations for intrinsic value and NPV refresh in real-time.
- Test Scenarios: Generate various forecasts and instantly compare the results.
- Make Decisions: Utilize the valuation outcomes to inform your investment approach.
Why Choose This Calculator for Chongqing Taiji Industry (Group) Co., Ltd (600129SS)?
- Designed for Experts: A sophisticated tool utilized by industry analysts, financial officers, and consultants.
- Authentic Data: Taiji's historical and projected financial information pre-loaded for reliable results.
- Flexible Scenario Analysis: Effortlessly simulate various forecasts and assumptions.
- Comprehensive Outputs: Automatically computes intrinsic value, NPV, and essential financial metrics.
- User-Friendly: Step-by-step guidance makes the process straightforward.
Who Can Benefit from This Product?
- Investors: Evaluate the valuation of Chongqing Taiji Industry(Group) Co.,Ltd (600129SS) before making stock transactions.
- CFOs and Financial Analysts: Optimize valuation methodologies and validate financial forecasts.
- Startup Founders: Discover the valuation strategies employed by established companies like Chongqing Taiji Industry(Group) Co.,Ltd (600129SS).
- Consultants: Provide comprehensive valuation reports to assist your clients.
- Students and Educators: Utilize authentic data to apply and instruct valuation practices.
Contents of the Template
- Comprehensive DCF Model: An editable template featuring detailed valuation calculations.
- Real-World Data: Historical and projected financials of Chongqing Taiji Industry (Group) Co., Ltd (600129SS) included for thorough analysis.
- Customizable Parameters: Modify WACC, growth rates, and tax assumptions to explore various scenarios.
- Financial Statements: Complete annual and quarterly financial breakdowns for enhanced insights.
- Key Ratios: Integrated analysis for evaluating profitability, efficiency, and leverage.
- Dashboard with Visual Outputs: Charts and tables designed for clear, actionable insights.
Disclaimer
All information, articles, and product details provided on this website are for general informational and educational purposes only. We do not claim any ownership over, nor do we intend to infringe upon, any trademarks, copyrights, logos, brand names, or other intellectual property mentioned or depicted on this site. Such intellectual property remains the property of its respective owners, and any references here are made solely for identification or informational purposes, without implying any affiliation, endorsement, or partnership.
We make no representations or warranties, express or implied, regarding the accuracy, completeness, or suitability of any content or products presented. Nothing on this website should be construed as legal, tax, investment, financial, medical, or other professional advice. In addition, no part of this site—including articles or product references—constitutes a solicitation, recommendation, endorsement, advertisement, or offer to buy or sell any securities, franchises, or other financial instruments, particularly in jurisdictions where such activity would be unlawful.
All content is of a general nature and may not address the specific circumstances of any individual or entity. It is not a substitute for professional advice or services. Any actions you take based on the information provided here are strictly at your own risk. You accept full responsibility for any decisions or outcomes arising from your use of this website and agree to release us from any liability in connection with your use of, or reliance upon, the content or products found herein.