
|
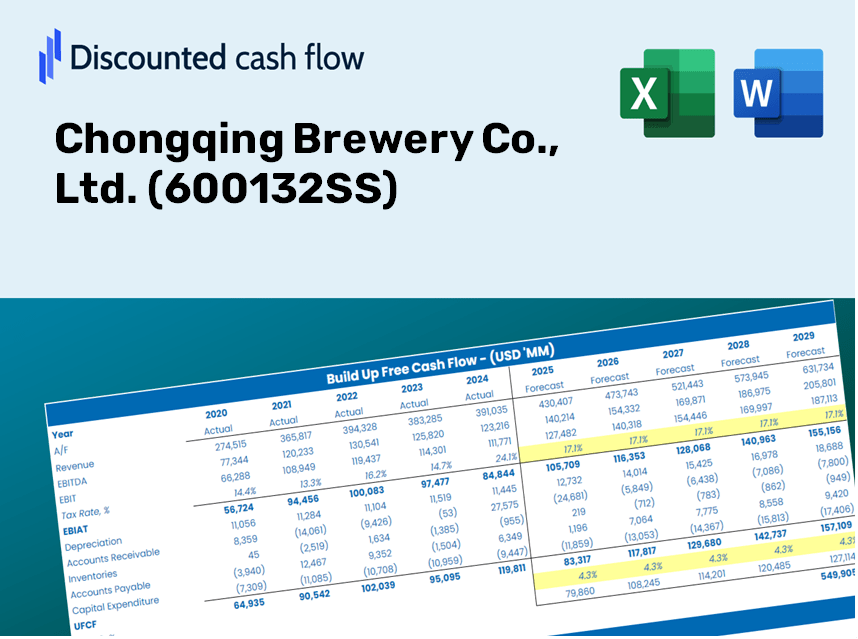
Chongqing Brewery Co., Ltd. (600132.SS) DCF Valuation |
Fully Editable: Tailor To Your Needs In Excel Or Sheets
Professional Design: Trusted, Industry-Standard Templates
Investor-Approved Valuation Models
MAC/PC Compatible, Fully Unlocked
No Expertise Is Needed; Easy To Follow
Chongqing Brewery Co., Ltd. (600132.SS) Bundle
Discover the true value of Chongqing Brewery Co., Ltd. (600132SS) with our professional-grade DCF Calculator! Adjust key assumptions, explore various scenarios, and analyze the effects of changes on Chongqing Brewery Co., Ltd. (600132SS) valuation – all within a single Excel template.
Benefits You Will Receive
- Authentic 600132SS Financial Data: Comes pre-loaded with Chongqing Brewery's historical and forecasted figures for accurate analysis.
- Completely Customizable Template: Easily adjust essential inputs such as revenue growth, WACC, and EBITDA percentage.
- Instant Calculations: Watch the intrinsic value of Chongqing Brewery update in real-time as you make adjustments.
- Expert Valuation Tool: Tailored for investors, analysts, and consultants in need of reliable DCF outcomes.
- Intuitive Design: Features a straightforward layout and clear guidance suitable for users of all experience levels.
Key Features
- Pre-Loaded Data: Chongqing Brewery’s historical financial statements and pre-filled forecasts.
- Fully Adjustable Inputs: Modify WACC, tax rates, revenue growth, and EBITDA margins as needed.
- Instant Results: View Chongqing Brewery’s intrinsic value recalculating in real time.
- Clear Visual Outputs: Dashboard charts present valuation results and essential metrics.
- Built for Accuracy: A professional tool designed for analysts, investors, and finance professionals.
How It Works
- Step 1: Download the Excel file for Chongqing Brewery Co., Ltd. (600132SS).
- Step 2: Review the pre-filled financial data and forecasts related to Chongqing Brewery.
- Step 3: Adjust key inputs such as revenue growth, WACC, and tax rates (highlighted cells).
- Step 4: See the DCF model update in real-time as you modify your assumptions.
- Step 5: Evaluate the outputs and leverage the results for your investment strategies.
Why Choose This Calculator for Chongqing Brewery Co., Ltd. (600132SS)?
- Designed for Experts: A sophisticated tool favored by analysts, CFOs, and industry consultants.
- Accurate Financial Data: Historical and projected financials for Chongqing Brewery preloaded for precision.
- Flexible Scenario Analysis: Effortlessly simulate various forecasts and assumptions.
- Comprehensive Outputs: Automatically calculates intrinsic value, NPV, and essential metrics.
- User-Friendly Experience: Step-by-step guidance to ensure a smooth calculation process.
Who Can Benefit from This Product?
- Investors: Accurately assess the fair value of Chongqing Brewery Co., Ltd. (600132SS) before making investment choices.
- CFOs: Utilize a professional-grade DCF model for comprehensive financial reporting and analysis.
- Consultants: Easily customize the template for client valuation reports.
- Entrepreneurs: Discover financial modeling techniques employed by leading companies in the industry.
- Educators: Use this tool to illustrate valuation methodologies in a classroom setting.
Contents of the Template
- Pre-Filled Data: Contains Chongqing Brewery Co., Ltd.'s historical financials and projections.
- Discounted Cash Flow Model: An editable DCF valuation model featuring automatic calculations.
- Weighted Average Cost of Capital (WACC): A dedicated sheet for WACC calculations based on customized inputs.
- Key Financial Ratios: Evaluate Chongqing Brewery's profitability, efficiency, and leverage metrics.
- Customizable Inputs: Easily adjust revenue growth, margins, and tax rates.
- Clear Dashboard: Visuals and tables providing a summary of essential valuation results.
Disclaimer
All information, articles, and product details provided on this website are for general informational and educational purposes only. We do not claim any ownership over, nor do we intend to infringe upon, any trademarks, copyrights, logos, brand names, or other intellectual property mentioned or depicted on this site. Such intellectual property remains the property of its respective owners, and any references here are made solely for identification or informational purposes, without implying any affiliation, endorsement, or partnership.
We make no representations or warranties, express or implied, regarding the accuracy, completeness, or suitability of any content or products presented. Nothing on this website should be construed as legal, tax, investment, financial, medical, or other professional advice. In addition, no part of this site—including articles or product references—constitutes a solicitation, recommendation, endorsement, advertisement, or offer to buy or sell any securities, franchises, or other financial instruments, particularly in jurisdictions where such activity would be unlawful.
All content is of a general nature and may not address the specific circumstances of any individual or entity. It is not a substitute for professional advice or services. Any actions you take based on the information provided here are strictly at your own risk. You accept full responsibility for any decisions or outcomes arising from your use of this website and agree to release us from any liability in connection with your use of, or reliance upon, the content or products found herein.