
|
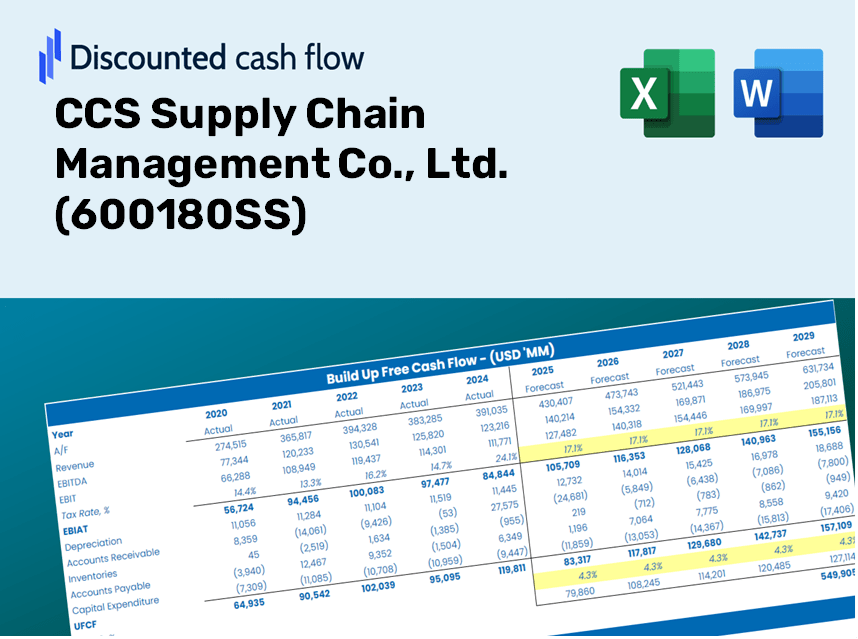
CCS Supply Chain Management Co., Ltd. (600180.SS) DCF Valuation |
Fully Editable: Tailor To Your Needs In Excel Or Sheets
Professional Design: Trusted, Industry-Standard Templates
Investor-Approved Valuation Models
MAC/PC Compatible, Fully Unlocked
No Expertise Is Needed; Easy To Follow
CCS Supply Chain Management Co., Ltd. (600180.SS) Bundle
Discover the true potential of CCS Supply Chain Management Co., Ltd. (600180SS) with our professional-grade DCF Calculator! Adjust key assumptions, explore various scenarios, and evaluate how different changes affect CCS Supply Chain Management Co., Ltd. (600180SS) valuation – all within a single Excel template.
Benefits You Will Receive
- Genuine CCS Financial Data: Access to both historical and projected figures for precise valuation.
- Customizable Parameters: Adjust WACC, tax rates, revenue growth, and capital expenditure inputs.
- Instantaneous Calculations: Dynamic calculations for intrinsic value and NPV.
- Scenario Evaluation: Explore various scenarios to assess CCS Supply Chain Management Co., Ltd.'s future outlook.
- User-Friendly and Professional Design: Designed for industry experts while remaining approachable for newcomers.
Key Features
- Comprehensive DCF Calculator: Offers both unlevered and levered DCF valuation models tailored for CCS Supply Chain Management Co., Ltd. (600180SS).
- WACC Analyzer: Features a pre-configured Weighted Average Cost of Capital sheet that allows for adjustable inputs.
- Customizable Forecast Assumptions: Easily adjust growth rates, capital expenditures, and discount rates.
- Integrated Financial Ratios: Assess profitability, leverage, and efficiency ratios specific to CCS Supply Chain Management Co., Ltd. (600180SS).
- User-Friendly Dashboard and Charts: Visual representations summarize essential valuation metrics for straightforward analysis.
How It Works
- Step 1: Download the Excel file.
- Step 2: Examine the pre-filled data for CCS Supply Chain Management Co., Ltd. (600180SS) including historical performance and future projections.
- Step 3: Modify key assumptions (highlighted in yellow) based on your insights.
- Step 4: Observe the automatic recalculations reflecting CCS Supply Chain Management's intrinsic value.
- Step 5: Utilize the results for your investment strategies or reporting needs.
Why Choose CCS Supply Chain Management Co., Ltd. (600180SS)?
- User-Friendly Interface: Tailored for both novices and seasoned professionals.
- Customizable Parameters: Effortlessly adjust inputs to suit your specific analysis needs.
- Real-Time Insights: Witness immediate updates to CCS's performance metrics as you modify inputs.
- Out-of-the-Box Functionality: Comes pre-loaded with CCS's current financial metrics for swift evaluations.
- Relied Upon by Experts: A go-to tool for investors and analysts seeking informed decision-making.
Who Should Use CCS Supply Chain Management?
- Supply Chain Professionals: Enhance your understanding of supply chain optimization with real-world scenarios.
- Researchers: Integrate innovative supply chain models into your studies or academic projects.
- Investors: Validate your investment hypotheses and evaluate the performance metrics of CCS Supply Chain Management (600180SS).
- Business Analysts: Improve efficiency with our user-friendly and customizable supply chain analysis tools.
- Entrepreneurs: Discover best practices for analyzing supply chain strategies of leading companies.
Contents of the Template
- Preloaded CCS Data: Historical and projected financial figures, including revenue, EBIT, and capital expenditures.
- DCF and WACC Models: Advanced spreadsheets for determining intrinsic value and Weighted Average Cost of Capital.
- Editable Inputs: Cells highlighted in yellow for modifying revenue growth, tax rates, and discount rates.
- Financial Statements: Detailed annual and quarterly financial reports for thorough analysis.
- Key Ratios: Metrics for profitability, leverage, and efficiency to assess performance.
- Dashboard and Charts: Visual summaries illustrating valuation results and assumptions.
Disclaimer
All information, articles, and product details provided on this website are for general informational and educational purposes only. We do not claim any ownership over, nor do we intend to infringe upon, any trademarks, copyrights, logos, brand names, or other intellectual property mentioned or depicted on this site. Such intellectual property remains the property of its respective owners, and any references here are made solely for identification or informational purposes, without implying any affiliation, endorsement, or partnership.
We make no representations or warranties, express or implied, regarding the accuracy, completeness, or suitability of any content or products presented. Nothing on this website should be construed as legal, tax, investment, financial, medical, or other professional advice. In addition, no part of this site—including articles or product references—constitutes a solicitation, recommendation, endorsement, advertisement, or offer to buy or sell any securities, franchises, or other financial instruments, particularly in jurisdictions where such activity would be unlawful.
All content is of a general nature and may not address the specific circumstances of any individual or entity. It is not a substitute for professional advice or services. Any actions you take based on the information provided here are strictly at your own risk. You accept full responsibility for any decisions or outcomes arising from your use of this website and agree to release us from any liability in connection with your use of, or reliance upon, the content or products found herein.