
|
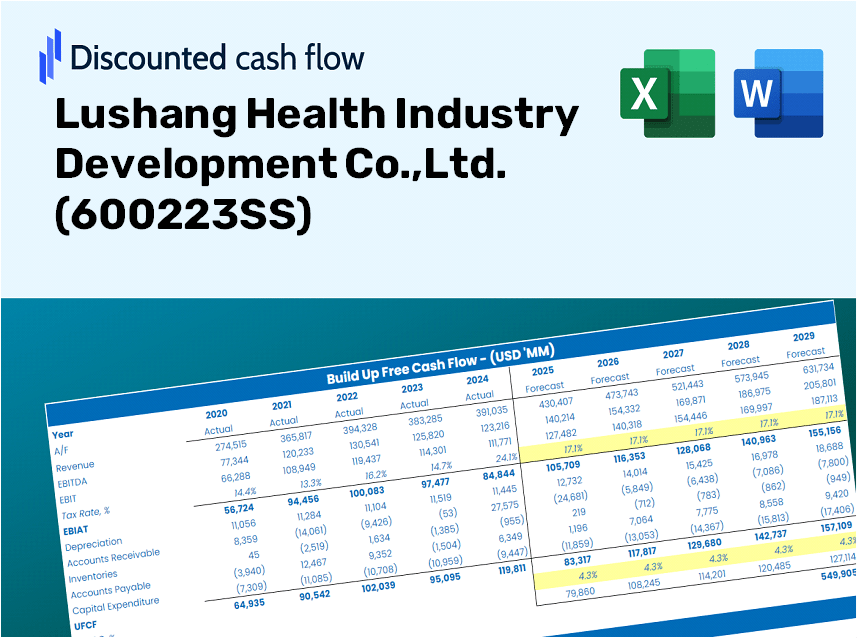
Lushang Health Industry Development Co.,Ltd. (600223.SS) DCF Valuation |
Fully Editable: Tailor To Your Needs In Excel Or Sheets
Professional Design: Trusted, Industry-Standard Templates
Investor-Approved Valuation Models
MAC/PC Compatible, Fully Unlocked
No Expertise Is Needed; Easy To Follow
Lushang Health Industry Development Co.,Ltd. (600223.SS) Bundle
Discover the true potential of Lushang Health Industry Development Co., Ltd. (600223SS) with our advanced DCF Calculator! Adjust key assumptions, explore various scenarios, and evaluate how different changes affect the valuation of Lushang Health – all within one convenient Excel template.
Discounted Cash Flow (DCF) - (USD MM)
| Year | AY1 2020 |
AY2 2021 |
AY3 2022 |
AY4 2023 |
AY5 2024 |
FY1 2025 |
FY2 2026 |
FY3 2027 |
FY4 2028 |
FY5 2029 |
|---|---|---|---|---|---|---|---|---|---|---|
| Revenue | 13,615.5 | 12,363.3 | 12,951.4 | 4,578.7 | 3,982.6 | 3,165.1 | 2,515.4 | 1,999.1 | 1,588.7 | 1,262.6 |
| Revenue Growth, % | 0 | -9.2 | 4.76 | -64.65 | -13.02 | -20.53 | -20.53 | -20.53 | -20.53 | -20.53 |
| EBITDA | 852.0 | 729.5 | 692.1 | 363.5 | 308.4 | 210.1 | 166.9 | 132.7 | 105.4 | 83.8 |
| EBITDA, % | 6.26 | 5.9 | 5.34 | 7.94 | 7.74 | 6.64 | 6.64 | 6.64 | 6.64 | 6.64 |
| Depreciation | 86.0 | 92.6 | 116.5 | 135.8 | 93.7 | 48.1 | 38.2 | 30.4 | 24.1 | 19.2 |
| Depreciation, % | 0.6316 | 0.74918 | 0.8994 | 2.97 | 2.35 | 1.52 | 1.52 | 1.52 | 1.52 | 1.52 |
| EBIT | 766.0 | 636.9 | 575.7 | 227.7 | 214.7 | 162.0 | 128.7 | 102.3 | 81.3 | 64.6 |
| EBIT, % | 5.63 | 5.15 | 4.44 | 4.97 | 5.39 | 5.12 | 5.12 | 5.12 | 5.12 | 5.12 |
| Total Cash | 5,073.9 | 5,138.5 | 4,318.0 | 1,733.6 | 2,947.7 | 1,418.2 | 1,127.1 | 895.8 | 711.9 | 565.8 |
| Total Cash, percent | .0 | .0 | .0 | .0 | .0 | .0 | .0 | .0 | .0 | .0 |
| Account Receivables | .0 | 1,532.5 | 428.3 | 599.1 | 531.1 | 266.6 | 211.9 | 168.4 | 133.8 | 106.4 |
| Account Receivables, % | 0 | 12.4 | 3.31 | 13.08 | 13.34 | 8.42 | 8.42 | 8.42 | 8.42 | 8.42 |
| Inventories | 46,664.9 | 48,203.8 | 46,047.0 | 525.4 | 558.7 | 2,060.5 | 1,637.5 | 1,301.4 | 1,034.3 | 822.0 |
| Inventories, % | 342.73 | 389.9 | 355.54 | 11.48 | 14.03 | 65.1 | 65.1 | 65.1 | 65.1 | 65.1 |
| Accounts Payable | 8,387.7 | 8,693.8 | 9,266.4 | 453.0 | 413.3 | 1,416.3 | 1,125.6 | 894.6 | 710.9 | 565.0 |
| Accounts Payable, % | 61.6 | 70.32 | 71.55 | 9.89 | 10.38 | 44.75 | 44.75 | 44.75 | 44.75 | 44.75 |
| Capital Expenditure | -157.1 | -281.5 | -166.1 | -211.4 | -157.2 | -84.0 | -66.8 | -53.1 | -42.2 | -33.5 |
| Capital Expenditure, % | -1.15 | -2.28 | -1.28 | -4.62 | -3.95 | -2.66 | -2.66 | -2.66 | -2.66 | -2.66 |
| Tax Rate, % | 29.68 | 29.68 | 29.68 | 29.68 | 29.68 | 29.68 | 29.68 | 29.68 | 29.68 | 29.68 |
| EBITAT | 573.2 | 358.1 | 100.2 | 167.3 | 151.0 | 94.7 | 75.2 | 59.8 | 47.5 | 37.8 |
| Depreciation | ||||||||||
| Changes in Account Receivables | ||||||||||
| Changes in Inventories | ||||||||||
| Changes in Accounts Payable | ||||||||||
| Capital Expenditure | ||||||||||
| UFCF | -37,775.0 | -2,596.2 | 3,884.1 | 36,629.2 | 82.5 | -175.6 | 233.6 | 185.7 | 147.6 | 117.3 |
| WACC, % | 9.98 | 9.92 | 9.81 | 9.97 | 9.96 | 9.93 | 9.93 | 9.93 | 9.93 | 9.93 |
| PV UFCF | ||||||||||
| SUM PV UFCF | 347.4 | |||||||||
| Long Term Growth Rate, % | 2.00 | |||||||||
| Free cash flow (T + 1) | 120 | |||||||||
| Terminal Value | 1,509 | |||||||||
| Present Terminal Value | 940 | |||||||||
| Enterprise Value | 1,287 | |||||||||
| Net Debt | -2,684 | |||||||||
| Equity Value | 3,971 | |||||||||
| Diluted Shares Outstanding, MM | 1,015 | |||||||||
| Equity Value Per Share | 3.91 |
What You Will Receive
- Adjustable Forecast Inputs: Modify key assumptions (growth %, profit margins, discount rate) effortlessly to explore various scenarios.
- Relevant Financial Data: Lushang Health Industry Development Co.,Ltd.’s financial information pre-loaded to enhance your analysis.
- Instant DCF Results: The template automatically computes Net Present Value (NPV) and intrinsic value for you.
- Versatile and Professional Design: A refined Excel model that can be tailored to fit your valuation requirements.
- Designed for Analysts and Investors: Perfect for testing forecasts, evaluating strategies, and maximizing efficiency.
Key Features
- Comprehensive Data Access: Lushang Health's historical financial statements and pre-compiled projections.
- Customizable Parameters: Modify WACC, tax rates, revenue growth, and EBITDA margins as needed.
- Real-Time Calculations: Instantly view Lushang's intrinsic value recalculating live.
- Intuitive Visualizations: Interactive dashboard charts present valuation results and essential metrics.
- Designed for Precision: A reliable tool tailored for analysts, investors, and finance professionals.
How It Functions
- Download: Obtain the pre-configured Excel spreadsheet featuring Lushang Health Industry Development Co.,Ltd.'s (600223SS) financial information.
- Customize: Modify your projections, such as revenue growth, EBITDA %, and WACC.
- Automatic Updates: Watch as intrinsic value and NPV calculations refresh in real-time.
- Scenario Testing: Build various forecasts and instantly assess different outcomes.
- Informed Decisions: Leverage the valuation results to inform your investment tactics.
Why Choose Lushang Health Industry Development Co., Ltd. ([600223SS])?
- Time-Saving: Skip the hassle of building a DCF model from the ground up – our tools are ready for immediate use.
- Enhanced Accuracy: Dependable financial data and formulas minimize errors in your valuation process.
- Customizable Options: Adapt the model to suit your unique assumptions and forecasts.
- User-Friendly Insights: Intuitive charts and outputs simplify data analysis and interpretation.
- Expert-Approved: Crafted for professionals who prioritize accuracy and functionality.
Who Should Use This Product?
- Healthcare Professionals: Learn advanced health industry practices and apply them to real-world scenarios.
- Researchers: Integrate industry-standard models into your studies or publications.
- Investors: Validate your investment strategies and evaluate the financial performance of Lushang Health Industry Development Co.,Ltd. (600223SS).
- Market Analysts: Enhance your analysis process with a ready-to-use, customizable financial model.
- Entrepreneurs: Discover insights into how large health companies like Lushang are assessed and valued.
What the Template Contains
- Historical Data: Includes Lushang Health Industry Development Co., Ltd.'s past financials and baseline forecasts.
- DCF and Levered DCF Models: Detailed templates to calculate Lushang Health's intrinsic value.
- WACC Sheet: Pre-built calculations for Weighted Average Cost of Capital.
- Editable Inputs: Modify key drivers like growth rates, EBITDA %, and CAPEX assumptions.
- Quarterly and Annual Statements: A complete breakdown of Lushang Health’s financials.
- Interactive Dashboard: Visualize valuation results and projections dynamically.
Disclaimer
All information, articles, and product details provided on this website are for general informational and educational purposes only. We do not claim any ownership over, nor do we intend to infringe upon, any trademarks, copyrights, logos, brand names, or other intellectual property mentioned or depicted on this site. Such intellectual property remains the property of its respective owners, and any references here are made solely for identification or informational purposes, without implying any affiliation, endorsement, or partnership.
We make no representations or warranties, express or implied, regarding the accuracy, completeness, or suitability of any content or products presented. Nothing on this website should be construed as legal, tax, investment, financial, medical, or other professional advice. In addition, no part of this site—including articles or product references—constitutes a solicitation, recommendation, endorsement, advertisement, or offer to buy or sell any securities, franchises, or other financial instruments, particularly in jurisdictions where such activity would be unlawful.
All content is of a general nature and may not address the specific circumstances of any individual or entity. It is not a substitute for professional advice or services. Any actions you take based on the information provided here are strictly at your own risk. You accept full responsibility for any decisions or outcomes arising from your use of this website and agree to release us from any liability in connection with your use of, or reliance upon, the content or products found herein.