
|
China Avionics Systems Co.,Ltd. (600372.SS) DCF Valuation |
Fully Editable: Tailor To Your Needs In Excel Or Sheets
Professional Design: Trusted, Industry-Standard Templates
Investor-Approved Valuation Models
MAC/PC Compatible, Fully Unlocked
No Expertise Is Needed; Easy To Follow
China Avionics Systems Co.,Ltd. (600372.SS) Bundle
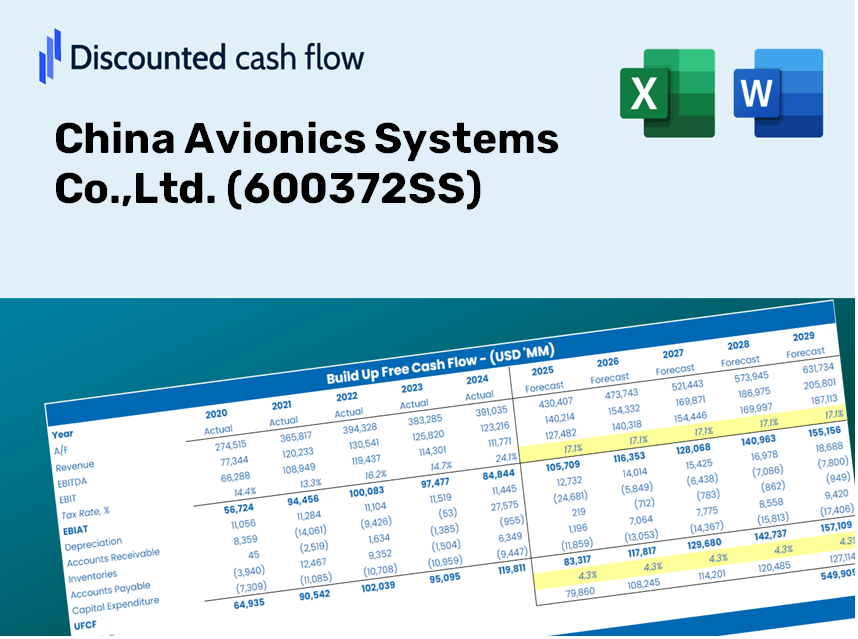
Streamline China Avionics Systems Co.,Ltd. (600372SS) valuation with this customizable DCF Calculator! Equipped with real China Avionics Systems Co.,Ltd. (600372SS) financials and adjustable forecast inputs, you can test scenarios and discover China Avionics Systems Co.,Ltd. (600372SS) fair value in minutes.
Discounted Cash Flow (DCF) - (USD MM)
| Year | AY1 2020 |
AY2 2021 |
AY3 2022 |
AY4 2023 |
AY5 2024 |
FY1 2025 |
FY2 2026 |
FY3 2027 |
FY4 2028 |
FY5 2029 |
|---|---|---|---|---|---|---|---|---|---|---|
| Revenue | 8,746.6 | 9,839.3 | 27,722.3 | 29,006.9 | 23,879.7 | 29,816.9 | 37,230.1 | 46,486.5 | 58,044.3 | 72,475.7 |
| Revenue Growth, % | 0 | 12.49 | 181.75 | 4.63 | -17.68 | 24.86 | 24.86 | 24.86 | 24.86 | 24.86 |
| EBITDA | 1,310.3 | 1,361.8 | 3,458.5 | 3,563.4 | 2,558.1 | 3,834.1 | 4,787.4 | 5,977.7 | 7,463.9 | 9,319.6 |
| EBITDA, % | 14.98 | 13.84 | 12.48 | 12.28 | 10.71 | 12.86 | 12.86 | 12.86 | 12.86 | 12.86 |
| Depreciation | 369.8 | 450.5 | 1,405.8 | 1,453.5 | 1,363.8 | 1,467.0 | 1,831.7 | 2,287.2 | 2,855.8 | 3,565.8 |
| Depreciation, % | 4.23 | 4.58 | 5.07 | 5.01 | 5.71 | 4.92 | 4.92 | 4.92 | 4.92 | 4.92 |
| EBIT | 940.5 | 911.3 | 2,052.7 | 2,110.0 | 1,194.4 | 2,367.1 | 2,955.6 | 3,690.5 | 4,608.0 | 5,753.7 |
| EBIT, % | 10.75 | 9.26 | 7.4 | 7.27 | 5 | 7.94 | 7.94 | 7.94 | 7.94 | 7.94 |
| Total Cash | 3,946.8 | 3,940.3 | 3,190.4 | 13,709.1 | 13,044.8 | 11,841.3 | 14,785.4 | 18,461.4 | 23,051.4 | 28,782.6 |
| Total Cash, percent | .0 | .0 | .0 | .0 | .0 | .0 | .0 | .0 | .0 | .0 |
| Account Receivables | 9,054.0 | 8,700.6 | 11,222.5 | 27,294.2 | 29,953.8 | 25,225.3 | 31,497.0 | 39,328.0 | 49,105.9 | 61,315.0 |
| Account Receivables, % | 103.51 | 88.43 | 40.48 | 94.1 | 125.44 | 84.6 | 84.6 | 84.6 | 84.6 | 84.6 |
| Inventories | 4,746.8 | 6,112.0 | 7,105.8 | 13,893.5 | 15,647.9 | 15,233.2 | 19,020.6 | 23,749.6 | 29,654.4 | 37,027.2 |
| Inventories, % | 54.27 | 62.12 | 25.63 | 47.9 | 65.53 | 51.09 | 51.09 | 51.09 | 51.09 | 51.09 |
| Accounts Payable | 6,685.7 | 6,980.6 | 10,274.8 | 13,468.4 | 21,419.1 | 19,117.0 | 23,870.0 | 29,804.7 | 37,215.0 | 46,467.6 |
| Accounts Payable, % | 76.44 | 70.95 | 37.06 | 46.43 | 89.7 | 64.11 | 64.11 | 64.11 | 64.11 | 64.11 |
| Capital Expenditure | -880.7 | -820.4 | -507.2 | -1,435.4 | -1,998.1 | -2,000.9 | -2,498.3 | -3,119.5 | -3,895.1 | -4,863.5 |
| Capital Expenditure, % | -10.07 | -8.34 | -1.83 | -4.95 | -8.37 | -6.71 | -6.71 | -6.71 | -6.71 | -6.71 |
| Tax Rate, % | 20.46 | 20.46 | 20.46 | 20.46 | 20.46 | 20.46 | 20.46 | 20.46 | 20.46 | 20.46 |
| EBITAT | 824.5 | 826.0 | 1,439.2 | 1,763.8 | 950.0 | 1,948.4 | 2,432.9 | 3,037.7 | 3,793.0 | 4,736.1 |
| Depreciation | ||||||||||
| Changes in Account Receivables | ||||||||||
| Changes in Inventories | ||||||||||
| Changes in Accounts Payable | ||||||||||
| Capital Expenditure | ||||||||||
| UFCF | -6,801.5 | -260.6 | 2,116.4 | -17,884.1 | 3,852.5 | 4,255.7 | -3,539.8 | -4,419.8 | -5,518.7 | -6,890.8 |
| WACC, % | 5.9 | 5.91 | 5.8 | 5.87 | 5.85 | 5.87 | 5.87 | 5.87 | 5.87 | 5.87 |
| PV UFCF | ||||||||||
| SUM PV UFCF | -12,438.1 | |||||||||
| Long Term Growth Rate, % | 2.00 | |||||||||
| Free cash flow (T + 1) | -7,029 | |||||||||
| Terminal Value | -181,729 | |||||||||
| Present Terminal Value | -136,649 | |||||||||
| Enterprise Value | -149,087 | |||||||||
| Net Debt | -2,892 | |||||||||
| Equity Value | -146,195 | |||||||||
| Diluted Shares Outstanding, MM | 4,838 | |||||||||
| Equity Value Per Share | -30.22 |
What You Will Receive
- Authentic 600372SS Financials: Contains both historical and projected data for precise valuation.
- Customizable Inputs: Adjust WACC, tax rates, revenue growth, and capital expenditures as needed.
- Real-Time Calculations: Intrinsic value and NPV are calculated in real-time.
- Scenario Analysis: Explore various scenarios to assess China Avionics Systems' future performance.
- User-Friendly Design: Designed for professionals while remaining approachable for newcomers.
Key Features
- Real-Time [Symbol] Data: Comes pre-populated with China Avionics Systems Co., Ltd.'s historical financial performance and forward-looking estimates.
- Customizable Parameters: Modify revenue growth rates, profit margins, WACC, tax rates, and capital expenditures to fit your analysis.
- Interactive Valuation Model: Automatically refreshes Net Present Value (NPV) and intrinsic value in response to your specific inputs.
- Multi-Scenario Analysis: Develop various forecast scenarios to examine a range of potential valuation results.
- Intuitive Interface: Designed with a clear layout that caters to both experienced users and newcomers.
How It Works
- Download: Access the pre-loaded Excel file featuring financial data for China Avionics Systems Co., Ltd. (600372SS).
- Customize: Modify forecasts such as revenue growth, EBITDA %, and WACC to suit your needs.
- Real-Time Updates: The intrinsic value and NPV calculations refresh automatically as you make changes.
- Scenario Testing: Generate various projections and instantly compare the results.
- Informed Decisions: Leverage the valuation findings to shape your investment approach.
Why Opt for This Calculator?
- All-in-One Solution: Combines DCF, WACC, and financial ratio analyses for comprehensive insights.
- Flexible Inputs: Modify the yellow-highlighted fields to explore different scenarios.
- In-Depth Analysis: Automatically computes the intrinsic value and Net Present Value for China Avionics Systems Co., Ltd. (600372SS).
- Rich Data Set: Comes with historical and projected data for reliable baseline calculations.
- Expert-Grade Features: Perfect for financial analysts, investors, and business consultants.
Who Should Utilize This Product?
- Professional Investors: Create comprehensive and accurate valuation models for portfolio assessments of China Avionics Systems Co.,Ltd. (600372SS).
- Corporate Finance Teams: Evaluate valuation scenarios to inform internal strategies for China Avionics Systems Co.,Ltd. (600372SS).
- Consultants and Advisors: Offer clients precise valuation insights for China Avionics Systems Co.,Ltd. (600372SS).
- Students and Educators: Leverage real-world data to enhance financial modeling practices and instruction using China Avionics Systems Co.,Ltd. (600372SS).
- Aerospace Enthusiasts: Gain an understanding of how companies like China Avionics Systems Co.,Ltd. (600372SS) are valued within the aerospace sector.
What the Template Contains
- Historical Data: Comprehensive financial history and baseline forecasts for China Avionics Systems Co., Ltd. (600372SS).
- DCF and Levered DCF Models: Detailed templates designed to assess the intrinsic value of China Avionics Systems Co., Ltd. (600372SS).
- WACC Sheet: Ready-to-use calculations for the Weighted Average Cost of Capital tailored for China Avionics Systems Co., Ltd. (600372SS).
- Editable Inputs: Customize key variables such as growth rates, EBITDA %, and CAPEX assumptions.
- Quarterly and Annual Statements: An in-depth analysis of the financial performance of China Avionics Systems Co., Ltd. (600372SS).
- Interactive Dashboard: Dynamically visualize valuation results and future projections.
Disclaimer
All information, articles, and product details provided on this website are for general informational and educational purposes only. We do not claim any ownership over, nor do we intend to infringe upon, any trademarks, copyrights, logos, brand names, or other intellectual property mentioned or depicted on this site. Such intellectual property remains the property of its respective owners, and any references here are made solely for identification or informational purposes, without implying any affiliation, endorsement, or partnership.
We make no representations or warranties, express or implied, regarding the accuracy, completeness, or suitability of any content or products presented. Nothing on this website should be construed as legal, tax, investment, financial, medical, or other professional advice. In addition, no part of this site—including articles or product references—constitutes a solicitation, recommendation, endorsement, advertisement, or offer to buy or sell any securities, franchises, or other financial instruments, particularly in jurisdictions where such activity would be unlawful.
All content is of a general nature and may not address the specific circumstances of any individual or entity. It is not a substitute for professional advice or services. Any actions you take based on the information provided here are strictly at your own risk. You accept full responsibility for any decisions or outcomes arising from your use of this website and agree to release us from any liability in connection with your use of, or reliance upon, the content or products found herein.