
|
Beijing Capital Development Co., Ltd. (600376.SS) DCF Valuation |
Fully Editable: Tailor To Your Needs In Excel Or Sheets
Professional Design: Trusted, Industry-Standard Templates
Investor-Approved Valuation Models
MAC/PC Compatible, Fully Unlocked
No Expertise Is Needed; Easy To Follow
Beijing Capital Development Co., Ltd. (600376.SS) Bundle
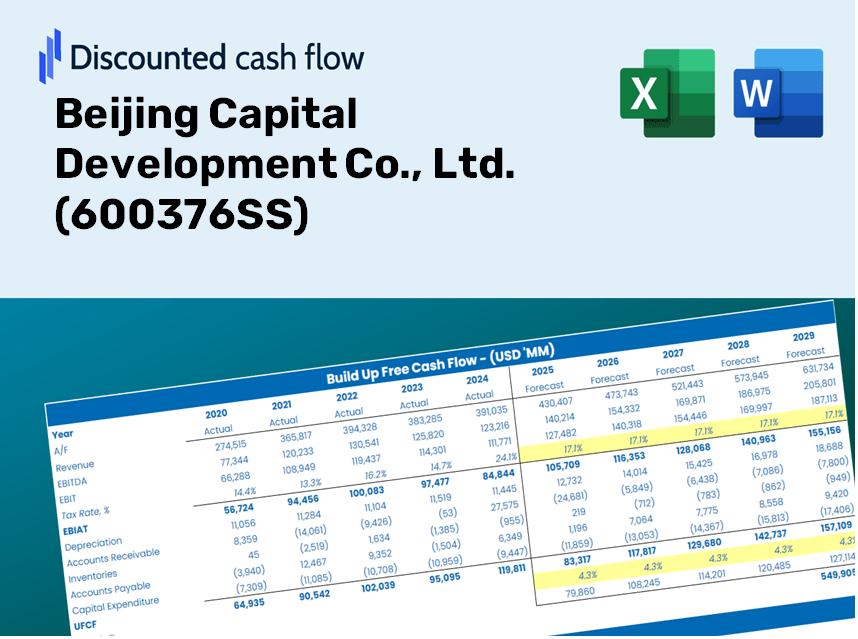
Simplify Beijing Capital Development Co., Ltd. (600376SS) valuation with this customizable DCF Calculator! Featuring real Beijing Capital Development Co., Ltd. (600376SS) financials and adjustable forecast inputs, you can test scenarios and uncover Beijing Capital Development Co., Ltd. (600376SS) fair value in minutes.
Discounted Cash Flow (DCF) - (USD MM)
| Year | AY1 2020 |
AY2 2021 |
AY3 2022 |
AY4 2023 |
AY5 2024 |
FY1 2025 |
FY2 2026 |
FY3 2027 |
FY4 2028 |
FY5 2029 |
|---|---|---|---|---|---|---|---|---|---|---|
| Revenue | 44,226.4 | 67,802.3 | 47,920.9 | 47,762.9 | 24,213.1 | 22,660.4 | 21,207.2 | 19,847.3 | 18,574.5 | 17,383.4 |
| Revenue Growth, % | 0 | 53.31 | -29.32 | -0.32956 | -49.31 | -6.41 | -6.41 | -6.41 | -6.41 | -6.41 |
| EBITDA | 7,507.8 | 6,227.4 | 4,769.9 | -298.5 | -4,162.9 | 829.2 | 776.0 | 726.3 | 679.7 | 636.1 |
| EBITDA, % | 16.98 | 9.18 | 9.95 | -0.6249 | -17.19 | 3.66 | 3.66 | 3.66 | 3.66 | 3.66 |
| Depreciation | 227.9 | 232.4 | 248.1 | 461.7 | 485.8 | 197.1 | 184.5 | 172.6 | 161.6 | 151.2 |
| Depreciation, % | 0.51522 | 0.34282 | 0.51783 | 0.96674 | 2.01 | 0.86981 | 0.86981 | 0.86981 | 0.86981 | 0.86981 |
| EBIT | 7,280.0 | 5,994.9 | 4,521.7 | -760.2 | -4,648.7 | 632.1 | 591.6 | 553.6 | 518.1 | 484.9 |
| EBIT, % | 16.46 | 8.84 | 9.44 | -1.59 | -19.2 | 2.79 | 2.79 | 2.79 | 2.79 | 2.79 |
| Total Cash | 35,553.0 | 31,400.3 | 20,534.7 | 22,949.1 | 18,837.4 | 13,387.6 | 12,529.1 | 11,725.7 | 10,973.7 | 10,270.0 |
| Total Cash, percent | .0 | .0 | .0 | .0 | .0 | .0 | .0 | .0 | .0 | .0 |
| Account Receivables | 621.2 | 59,309.0 | 823.9 | 50,372.5 | 47,442.6 | 13,170.1 | 12,325.5 | 11,535.1 | 10,795.4 | 10,103.1 |
| Account Receivables, % | 1.4 | 87.47 | 1.72 | 105.46 | 195.94 | 58.12 | 58.12 | 58.12 | 58.12 | 58.12 |
| Inventories | 190,760.0 | 170,520.8 | 149,788.0 | 126,040.6 | 109,272.8 | 22,660.4 | 21,207.2 | 19,847.3 | 18,574.5 | 17,383.4 |
| Inventories, % | 431.33 | 251.5 | 312.57 | 263.89 | 451.3 | 100 | 100 | 100 | 100 | 100 |
| Accounts Payable | 11,404.4 | 11,333.7 | 11,680.7 | 10,895.4 | 8,689.1 | 5,691.1 | 5,326.2 | 4,984.6 | 4,665.0 | 4,365.8 |
| Accounts Payable, % | 25.79 | 16.72 | 24.37 | 22.81 | 35.89 | 25.11 | 25.11 | 25.11 | 25.11 | 25.11 |
| Capital Expenditure | -634.0 | -773.1 | -580.7 | -298.2 | -190.9 | -235.6 | -220.5 | -206.3 | -193.1 | -180.7 |
| Capital Expenditure, % | -1.43 | -1.14 | -1.21 | -0.62443 | -0.78854 | -1.04 | -1.04 | -1.04 | -1.04 | -1.04 |
| Tax Rate, % | 9.46 | 9.46 | 9.46 | 9.46 | 9.46 | 9.46 | 9.46 | 9.46 | 9.46 | 9.46 |
| EBITAT | 3,566.2 | 431.7 | -1,143.3 | -923.8 | -4,208.7 | 311.9 | 291.9 | 273.2 | 255.7 | 239.3 |
| Depreciation | ||||||||||
| Changes in Account Receivables | ||||||||||
| Changes in Inventories | ||||||||||
| Changes in Accounts Payable | ||||||||||
| Capital Expenditure | ||||||||||
| UFCF | -176,816.6 | -38,628.4 | 78,089.0 | -27,346.8 | 13,577.6 | 118,160.5 | 2,188.6 | 2,048.3 | 1,916.9 | 1,794.0 |
| WACC, % | 3.32 | 1.91 | 1.67 | 5.04 | 4.73 | 3.34 | 3.34 | 3.34 | 3.34 | 3.34 |
| PV UFCF | ||||||||||
| SUM PV UFCF | 121,456.4 | |||||||||
| Long Term Growth Rate, % | 2.00 | |||||||||
| Free cash flow (T + 1) | 1,830 | |||||||||
| Terminal Value | 137,050 | |||||||||
| Present Terminal Value | 116,315 | |||||||||
| Enterprise Value | 237,772 | |||||||||
| Net Debt | 72,916 | |||||||||
| Equity Value | 164,856 | |||||||||
| Diluted Shares Outstanding, MM | 2,512 | |||||||||
| Equity Value Per Share | 65.63 |
What You Will Receive
- Authentic Beijing Capital Data: Comprehensive financial details – from revenue to EBIT – based on verified actuals and forward-looking estimates.
- Complete Customization: Modify all essential parameters (yellow cells) such as WACC, growth %, and tax rates to suit your analysis.
- Real-Time Valuation Adjustments: Automatic recalibrations to evaluate how changes affect the fair value of Beijing Capital Development Co., Ltd. (600376SS).
- Flexible Excel Template: Designed for quick modifications, scenario analysis, and in-depth forecasting.
- Efficient and Accurate: Eliminate the need to build models from the ground up while ensuring accuracy and adaptability.
Key Features
- Real-Life BCDC Data: Pre-filled with Beijing Capital Development Co., Ltd.'s historical financials and future growth forecasts.
- Fully Customizable Inputs: Modify revenue projections, profit margins, WACC, tax rates, and capital expenditures as needed.
- Dynamic Valuation Model: Automatically updates Net Present Value (NPV) and intrinsic value based on your selected inputs.
- Scenario Testing: Generate multiple forecast scenarios to evaluate various valuation possibilities.
- User-Friendly Design: Intuitive and structured interface, suitable for both professionals and newcomers.
How It Works
- Step 1: Download the Excel file.
- Step 2: Review the pre-entered data for Beijing Capital Development Co., Ltd. (600376SS) (historical and projected).
- Step 3: Modify key assumptions (highlighted in yellow) according to your analysis.
- Step 4: Observe the automatic recalculations for the intrinsic value of Beijing Capital Development Co., Ltd. (600376SS).
- Step 5: Utilize the results for making investment decisions or for reporting purposes.
Why Opt for This Calculator?
- User-Friendly: Crafted for both novices and seasoned professionals.
- Customizable Inputs: Easily adjust parameters to suit your analysis needs.
- Real-Time Insights: Observe immediate updates to Beijing Capital Development Co., Ltd.'s valuation as you modify inputs.
- Preloaded Data: Comes equipped with the latest financial data for quick assessments.
- Endorsed by Experts: Utilized by investors and analysts for making informed choices.
Who Should Use This Product?
- Professional Investors: Develop precise and dependable valuation models for analyzing portfolios involving Beijing Capital Development Co., Ltd. (600376SS).
- Corporate Finance Teams: Evaluate valuation scenarios to inform internal strategies related to Beijing Capital Development Co., Ltd. (600376SS).
- Consultants and Advisors: Deliver accurate valuation insights to clients regarding Beijing Capital Development Co., Ltd. (600376SS).
- Students and Educators: Utilize real-world data to enhance financial modeling skills in relation to Beijing Capital Development Co., Ltd. (600376SS).
- Real Estate Enthusiasts: Gain a deeper understanding of how companies like Beijing Capital Development Co., Ltd. (600376SS) are valued in the market.
Contents of the Template
- Preloaded BCD Data: Historical and projected financial data, including revenue, EBIT, and capital expenditures.
- DCF and WACC Models: Expert-level spreadsheets for determining intrinsic value and Weighted Average Cost of Capital.
- Editable Inputs: Cells highlighted in yellow for modifying revenue growth, tax rates, and discount rates.
- Financial Statements: Detailed annual and quarterly financials for thorough analysis.
- Key Ratios: Ratios for profitability, leverage, and efficiency to assess performance.
- Dashboard and Charts: Visual representations of valuation results and underlying assumptions.
Disclaimer
All information, articles, and product details provided on this website are for general informational and educational purposes only. We do not claim any ownership over, nor do we intend to infringe upon, any trademarks, copyrights, logos, brand names, or other intellectual property mentioned or depicted on this site. Such intellectual property remains the property of its respective owners, and any references here are made solely for identification or informational purposes, without implying any affiliation, endorsement, or partnership.
We make no representations or warranties, express or implied, regarding the accuracy, completeness, or suitability of any content or products presented. Nothing on this website should be construed as legal, tax, investment, financial, medical, or other professional advice. In addition, no part of this site—including articles or product references—constitutes a solicitation, recommendation, endorsement, advertisement, or offer to buy or sell any securities, franchises, or other financial instruments, particularly in jurisdictions where such activity would be unlawful.
All content is of a general nature and may not address the specific circumstances of any individual or entity. It is not a substitute for professional advice or services. Any actions you take based on the information provided here are strictly at your own risk. You accept full responsibility for any decisions or outcomes arising from your use of this website and agree to release us from any liability in connection with your use of, or reliance upon, the content or products found herein.