
|
Beijing Teamsun Technology Co.,Ltd. (600410.SS) DCF Valuation |
Fully Editable: Tailor To Your Needs In Excel Or Sheets
Professional Design: Trusted, Industry-Standard Templates
Investor-Approved Valuation Models
MAC/PC Compatible, Fully Unlocked
No Expertise Is Needed; Easy To Follow
Beijing Teamsun Technology Co.,Ltd. (600410.SS) Bundle
Discover the true value of Beijing Teamsun Technology Co.,Ltd. (600410SS) with our advanced DCF Calculator! Adjust key assumptions, explore various scenarios, and evaluate how changes affect the valuation of Beijing Teamsun Technology Co.,Ltd. (600410SS) – all within a comprehensive Excel template.
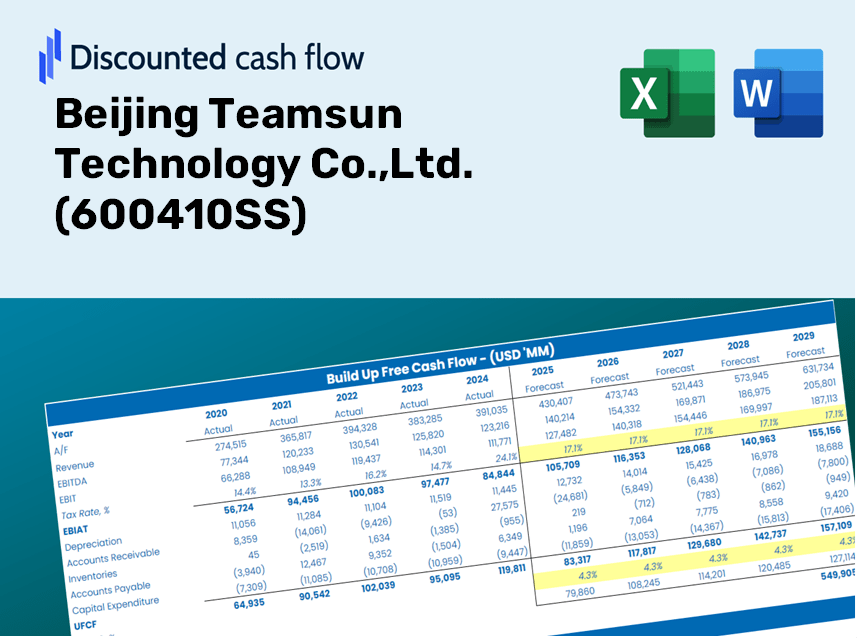
Discounted Cash Flow (DCF) - (USD MM)
| Year | AY1 2020 |
AY2 2021 |
AY3 2022 |
AY4 2023 |
AY5 2024 |
FY1 2025 |
FY2 2026 |
FY3 2027 |
FY4 2028 |
FY5 2029 |
|---|---|---|---|---|---|---|---|---|---|---|
| Revenue | 3,901.2 | 3,799.0 | 4,069.8 | 4,163.4 | 4,270.6 | 4,370.8 | 4,473.4 | 4,578.3 | 4,685.7 | 4,795.7 |
| Revenue Growth, % | 0 | -2.62 | 7.13 | 2.3 | 2.57 | 2.35 | 2.35 | 2.35 | 2.35 | 2.35 |
| EBITDA | -23.8 | 2.2 | -13.6 | 3.3 | 23.3 | -2.3 | -2.3 | -2.4 | -2.4 | -2.5 |
| EBITDA, % | -0.6089 | 0.05789714 | -0.33435 | 0.07984278 | 0.54649 | -0.05180496 | -0.05180496 | -0.05180496 | -0.05180496 | -0.05180496 |
| Depreciation | 155.9 | 199.3 | 175.4 | 160.6 | 32.2 | 158.8 | 162.5 | 166.3 | 170.2 | 174.2 |
| Depreciation, % | 4 | 5.25 | 4.31 | 3.86 | 0.75312 | 3.63 | 3.63 | 3.63 | 3.63 | 3.63 |
| EBIT | -179.6 | -197.1 | -189.0 | -157.3 | -8.8 | -161.0 | -164.8 | -168.7 | -172.6 | -176.7 |
| EBIT, % | -4.6 | -5.19 | -4.64 | -3.78 | -0.20664 | -3.68 | -3.68 | -3.68 | -3.68 | -3.68 |
| Total Cash | 2,163.4 | 2,115.0 | 1,777.3 | 2,030.0 | 1,996.7 | 2,188.1 | 2,239.5 | 2,292.0 | 2,345.8 | 2,400.8 |
| Total Cash, percent | .0 | .0 | .0 | .0 | .0 | .0 | .0 | .0 | .0 | .0 |
| Account Receivables | 1,268.7 | 1,350.2 | 1,383.2 | 1,306.2 | 1,064.6 | 1,384.2 | 1,416.7 | 1,450.0 | 1,484.0 | 1,518.8 |
| Account Receivables, % | 32.52 | 35.54 | 33.99 | 31.37 | 24.93 | 31.67 | 31.67 | 31.67 | 31.67 | 31.67 |
| Inventories | 687.2 | 559.2 | 535.8 | 653.1 | 802.7 | 699.2 | 715.6 | 732.4 | 749.6 | 767.1 |
| Inventories, % | 17.62 | 14.72 | 13.16 | 15.69 | 18.8 | 16 | 16 | 16 | 16 | 16 |
| Accounts Payable | 1,110.6 | 862.3 | 1,054.8 | 1,124.5 | 714.9 | 1,056.3 | 1,081.1 | 1,106.4 | 1,132.4 | 1,159.0 |
| Accounts Payable, % | 28.47 | 22.7 | 25.92 | 27.01 | 16.74 | 24.17 | 24.17 | 24.17 | 24.17 | 24.17 |
| Capital Expenditure | -170.0 | -118.9 | -103.3 | -157.6 | -64.8 | -134.0 | -137.1 | -140.3 | -143.6 | -147.0 |
| Capital Expenditure, % | -4.36 | -3.13 | -2.54 | -3.78 | -1.52 | -3.07 | -3.07 | -3.07 | -3.07 | -3.07 |
| Tax Rate, % | 70.14 | 70.14 | 70.14 | 70.14 | 70.14 | 70.14 | 70.14 | 70.14 | 70.14 | 70.14 |
| EBITAT | -33.8 | -54.5 | -167.2 | -167.4 | -2.6 | -85.3 | -87.3 | -89.3 | -91.4 | -93.5 |
| Depreciation | ||||||||||
| Changes in Account Receivables | ||||||||||
| Changes in Inventories | ||||||||||
| Changes in Accounts Payable | ||||||||||
| Capital Expenditure | ||||||||||
| UFCF | -893.2 | -175.7 | 87.7 | -135.0 | -352.7 | 64.7 | -86.0 | -88.0 | -90.1 | -92.2 |
| WACC, % | 4.38 | 4.41 | 4.61 | 4.64 | 4.42 | 4.49 | 4.49 | 4.49 | 4.49 | 4.49 |
| PV UFCF | ||||||||||
| SUM PV UFCF | -243.5 | |||||||||
| Long Term Growth Rate, % | 3.00 | |||||||||
| Free cash flow (T + 1) | -95 | |||||||||
| Terminal Value | -6,365 | |||||||||
| Present Terminal Value | -5,110 | |||||||||
| Enterprise Value | -5,353 | |||||||||
| Net Debt | -95 | |||||||||
| Equity Value | -5,258 | |||||||||
| Diluted Shares Outstanding, MM | 1,096 | |||||||||
| Equity Value Per Share | -4.80 |
What You Will Receive
- Authentic Beijing Teamsun Data: Preloaded financial statements – from revenue to EBIT – based on actual and projected figures.
- Comprehensive Customization: Modify all key variables (yellow cells) such as WACC, growth %, and tax rates.
- Instant Valuation Updates: Automatic recalculations to evaluate the impact of changes on Beijing Teamsun’s fair value.
- Flexible Excel Template: Designed for easy edits, scenario analysis, and detailed forecasts.
- Efficient and Accurate: Avoid building models from scratch while ensuring precision and adaptability.
Key Features
- 🔍 Real-Life 600410SS Financials: Pre-filled historical and projected data for Beijing Teamsun Technology Co., Ltd.
- ✏️ Fully Customizable Inputs: Adjust essential parameters (yellow cells) such as WACC, growth %, and tax rates.
- 📊 Professional DCF Valuation: Equipped with formulas to determine the intrinsic value of Beijing Teamsun Technology using the Discounted Cash Flow method.
- ⚡ Instant Results: Quickly visualize the company's valuation after any modifications.
- Scenario Analysis: Explore and compare outcomes for various financial assumptions side-by-side.
How It Functions
- Download: Obtain the comprehensive Excel file containing Beijing Teamsun Technology Co., Ltd.'s (600410SS) financial data.
- Customize: Modify projections such as revenue growth, EBITDA %, and WACC to fit your analysis.
- Update Automatically: Watch as intrinsic value and NPV calculations refresh in real-time.
- Test Scenarios: Generate various forecasts and instantly compare their results.
- Make Decisions: Leverage the valuation outcomes to inform your investment choices.
Why Choose Teamsun Technology Co., Ltd.?
- Precision: Data derived from authentic financial reports guarantees reliability.
- Adaptability: Built to allow users the freedom to experiment with and adjust inputs.
- Efficiency: Avoid the complexities of creating a financial model from the ground up.
- Enterprise-Grade: Crafted with the expertise and practicality expected at the CFO level.
- Intuitive: Simple interface that caters to users without extensive financial modeling knowledge.
Who Can Benefit from This Product?
- Finance Students: Master financial analysis and valuation methods using real-world data.
- Researchers: Integrate advanced financial models into your academic projects or studies.
- Investors: Validate your investment hypotheses and evaluate valuation metrics for Beijing Teamsun Technology Co.,Ltd. (600410SS).
- Financial Analysts: Enhance your analysis efficiency with a ready-to-use, customizable Discounted Cash Flow (DCF) model.
- Entrepreneurs: Understand the analytical frameworks applied to large public firms like Beijing Teamsun Technology Co.,Ltd. (600410SS).
Contents of the Template
- Operating and Balance Sheet Data: Pre-filled historical data and forecasts for Beijing Teamsun Technology Co., Ltd. (600410SS), covering revenue, EBITDA, EBIT, and capital expenditures.
- WACC Calculation: A dedicated sheet for Weighted Average Cost of Capital (WACC), featuring parameters such as Beta, risk-free rate, and share price.
- DCF Valuation (Unlevered and Levered): Customizable Discounted Cash Flow models detailing intrinsic value along with comprehensive calculations.
- Financial Statements: Pre-loaded financial statements (annual and quarterly) to facilitate in-depth analysis.
- Key Ratios: Includes profitability, leverage, and efficiency ratios for Beijing Teamsun Technology Co., Ltd. (600410SS).
- Dashboard and Charts: A visual overview of valuation outputs and assumptions for easier result analysis.
Disclaimer
All information, articles, and product details provided on this website are for general informational and educational purposes only. We do not claim any ownership over, nor do we intend to infringe upon, any trademarks, copyrights, logos, brand names, or other intellectual property mentioned or depicted on this site. Such intellectual property remains the property of its respective owners, and any references here are made solely for identification or informational purposes, without implying any affiliation, endorsement, or partnership.
We make no representations or warranties, express or implied, regarding the accuracy, completeness, or suitability of any content or products presented. Nothing on this website should be construed as legal, tax, investment, financial, medical, or other professional advice. In addition, no part of this site—including articles or product references—constitutes a solicitation, recommendation, endorsement, advertisement, or offer to buy or sell any securities, franchises, or other financial instruments, particularly in jurisdictions where such activity would be unlawful.
All content is of a general nature and may not address the specific circumstances of any individual or entity. It is not a substitute for professional advice or services. Any actions you take based on the information provided here are strictly at your own risk. You accept full responsibility for any decisions or outcomes arising from your use of this website and agree to release us from any liability in connection with your use of, or reliance upon, the content or products found herein.