
|
Hunan Corun New Energy Co., Ltd. (600478.SS) DCF Valuation |
Fully Editable: Tailor To Your Needs In Excel Or Sheets
Professional Design: Trusted, Industry-Standard Templates
Investor-Approved Valuation Models
MAC/PC Compatible, Fully Unlocked
No Expertise Is Needed; Easy To Follow
Hunan Corun New Energy Co., Ltd. (600478.SS) Bundle
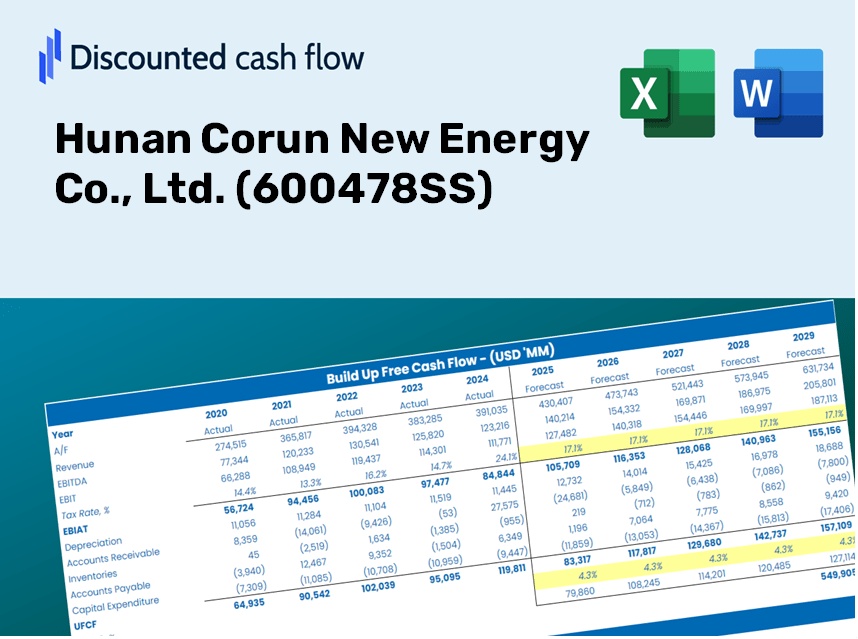
Gain insight into your Hunan Corun New Energy Co., Ltd. (600478SS) valuation analysis with our sophisticated DCF Calculator! This Excel template comes preloaded with real data for (600478SS), enabling you to adjust forecasts and assumptions to accurately determine the intrinsic value of Hunan Corun New Energy Co., Ltd.
Discounted Cash Flow (DCF) - (USD MM)
| Year | AY1 2020 |
AY2 2021 |
AY3 2022 |
AY4 2023 |
AY5 2024 |
FY1 2025 |
FY2 2026 |
FY3 2027 |
FY4 2028 |
FY5 2029 |
|---|---|---|---|---|---|---|---|---|---|---|
| Revenue | 2,545.8 | 3,058.6 | 3,785.8 | 3,704.6 | 3,938.2 | 4,411.5 | 4,941.8 | 5,535.8 | 6,201.2 | 6,946.6 |
| Revenue Growth, % | 0 | 20.14 | 23.78 | -2.15 | 6.3 | 12.02 | 12.02 | 12.02 | 12.02 | 12.02 |
| EBITDA | 135.7 | 285.9 | 423.9 | 201.5 | 385.4 | 362.6 | 406.2 | 455.1 | 509.7 | 571.0 |
| EBITDA, % | 5.33 | 9.35 | 11.2 | 5.44 | 9.79 | 8.22 | 8.22 | 8.22 | 8.22 | 8.22 |
| Depreciation | 272.0 | 290.1 | 245.1 | 237.0 | 241.2 | 345.5 | 387.1 | 433.6 | 485.7 | 544.1 |
| Depreciation, % | 10.69 | 9.48 | 6.47 | 6.4 | 6.12 | 7.83 | 7.83 | 7.83 | 7.83 | 7.83 |
| EBIT | -136.4 | -4.1 | 178.8 | -35.5 | 144.2 | 17.1 | 19.1 | 21.4 | 24.0 | 26.9 |
| EBIT, % | -5.36 | -0.13443 | 4.72 | -0.95751 | 3.66 | 0.38731 | 0.38731 | 0.38731 | 0.38731 | 0.38731 |
| Total Cash | 697.2 | 856.6 | 1,153.2 | 1,531.4 | 1,648.0 | 1,491.4 | 1,670.7 | 1,871.5 | 2,096.5 | 2,348.5 |
| Total Cash, percent | .0 | .0 | .0 | .0 | .0 | .0 | .0 | .0 | .0 | .0 |
| Account Receivables | 382.1 | 611.3 | 614.5 | 625.7 | 650.5 | 746.8 | 836.5 | 937.1 | 1,049.7 | 1,175.9 |
| Account Receivables, % | 15.01 | 19.99 | 16.23 | 16.89 | 16.52 | 16.93 | 16.93 | 16.93 | 16.93 | 16.93 |
| Inventories | 263.3 | 279.9 | 393.7 | 343.1 | 258.6 | 403.4 | 451.9 | 506.2 | 567.1 | 635.2 |
| Inventories, % | 10.34 | 9.15 | 10.4 | 9.26 | 6.57 | 9.14 | 9.14 | 9.14 | 9.14 | 9.14 |
| Accounts Payable | 421.2 | 561.3 | 1,189.0 | 1,249.1 | 1,235.1 | 1,159.2 | 1,298.5 | 1,454.6 | 1,629.4 | 1,825.3 |
| Accounts Payable, % | 16.54 | 18.35 | 31.41 | 33.72 | 31.36 | 26.28 | 26.28 | 26.28 | 26.28 | 26.28 |
| Capital Expenditure | -260.7 | -234.1 | -463.6 | -722.1 | -283.6 | -501.4 | -561.7 | -629.2 | -704.9 | -789.6 |
| Capital Expenditure, % | -10.24 | -7.65 | -12.25 | -19.49 | -7.2 | -11.37 | -11.37 | -11.37 | -11.37 | -11.37 |
| Tax Rate, % | -58.64 | -58.64 | -58.64 | -58.64 | -58.64 | -58.64 | -58.64 | -58.64 | -58.64 | -58.64 |
| EBITAT | -139.3 | -3.9 | 127.0 | -14.0 | 228.7 | 13.8 | 15.5 | 17.4 | 19.4 | 21.8 |
| Depreciation | ||||||||||
| Changes in Account Receivables | ||||||||||
| Changes in Inventories | ||||||||||
| Changes in Accounts Payable | ||||||||||
| Capital Expenditure | ||||||||||
| UFCF | -352.2 | -53.5 | 419.1 | -399.6 | 232.0 | -459.0 | -158.1 | -177.0 | -198.3 | -222.2 |
| WACC, % | 10.46 | 10.39 | 10.12 | 9.75 | 10.46 | 10.24 | 10.24 | 10.24 | 10.24 | 10.24 |
| PV UFCF | ||||||||||
| SUM PV UFCF | -949.4 | |||||||||
| Long Term Growth Rate, % | 3.00 | |||||||||
| Free cash flow (T + 1) | -229 | |||||||||
| Terminal Value | -3,163 | |||||||||
| Present Terminal Value | -1,943 | |||||||||
| Enterprise Value | -2,892 | |||||||||
| Net Debt | 822 | |||||||||
| Equity Value | -3,715 | |||||||||
| Diluted Shares Outstanding, MM | 1,563 | |||||||||
| Equity Value Per Share | -2.38 |
What You Will Receive
- Customizable Excel Template: A tailored Excel-based DCF Calculator featuring pre-filled real financial data for Hunan Corun New Energy Co., Ltd. (600478SS).
- Comprehensive Data: Access to historical data and forward-looking estimates (highlighted in the yellow cells).
- Flexible Forecasting: Adjust key assumptions such as revenue growth, EBITDA %, and WACC at your discretion.
- Instant Calculations: Quickly observe how your input changes affect the valuation of Hunan Corun New Energy Co., Ltd. (600478SS).
- Professional-Grade Tool: Designed for investors, CFOs, consultants, and financial analysts.
- User-Friendly Layout: Organized for simple navigation and ease of use, complemented by detailed step-by-step instructions.
Key Features
- Authentic Financial Data: Gain access to reliable historical figures and future estimates for Hunan Corun New Energy Co., Ltd. (600478SS).
- Tailored Forecast Parameters: Modify highlighted fields such as WACC, growth rates, and profit margins to suit your analysis.
- Real-Time Calculations: Experience automatic updates for DCF, Net Present Value (NPV), and cash flow evaluations.
- User-Friendly Dashboard: Intuitive charts and summaries that help you visualize your valuation insights.
- Designed for All Levels: An accessible and straightforward layout for investors, CFOs, and consultants alike.
How It Operates
- 1. Access the Template: Download and open the Excel file featuring Hunan Corun New Energy Co., Ltd. (600478SS) preloaded data.
- 2. Modify Assumptions: Adjust critical inputs such as growth projections, WACC, and capital expenditures.
- 3. Observe Results in Real-Time: The DCF model automatically computes intrinsic value and NPV.
- 4. Explore Scenarios: Evaluate various forecasts to assess different valuation outcomes.
- 5. Utilize with Assurance: Present expert valuation insights to reinforce your decision-making.
Why Choose This Calculator for Hunan Corun New Energy Co., Ltd. (600478SS)?
- Designed for Experts: A sophisticated tool favored by analysts, CFOs, and consultants in the energy sector.
- Comprehensive Data: Hunan Corun New Energy’s historical and projected financials integrated for precision.
- Flexible Scenario Analysis: Easily test various forecasts and assumptions for better decision-making.
- Insightful Outputs: Automatically computes intrinsic value, NPV, and essential financial metrics.
- User-Friendly: Step-by-step guidance makes the process straightforward and accessible.
Who Can Benefit from This Product?
- Energy Sector Students: Understand renewable energy valuation methods and apply them to real-world data.
- Researchers: Integrate advanced energy models into academic projects or studies.
- Investors: Evaluate your investment strategies and assess valuation projections for Hunan Corun New Energy Co., Ltd. (600478SS).
- Financial Analysts: Optimize your analysis process with a customizable DCF model specifically designed for the energy industry.
- Entrepreneurs: Discover the valuation techniques used for large-scale energy companies like Hunan Corun New Energy Co., Ltd. (600478SS).
Contents of the Template
- Pre-Filled Data: Contains Hunan Corun New Energy Co., Ltd.'s historical financial performance and projections.
- Discounted Cash Flow Model: An editable DCF valuation model featuring automatic calculations.
- Weighted Average Cost of Capital (WACC): A specific sheet for WACC calculations using personalized inputs.
- Key Financial Ratios: Evaluate Hunan Corun's profitability, efficiency, and financial leverage.
- Customizable Inputs: Easily adjust revenue growth, profit margins, and tax rates.
- Clear Dashboard: Visual summaries of key valuation results presented through charts and tables.
Disclaimer
All information, articles, and product details provided on this website are for general informational and educational purposes only. We do not claim any ownership over, nor do we intend to infringe upon, any trademarks, copyrights, logos, brand names, or other intellectual property mentioned or depicted on this site. Such intellectual property remains the property of its respective owners, and any references here are made solely for identification or informational purposes, without implying any affiliation, endorsement, or partnership.
We make no representations or warranties, express or implied, regarding the accuracy, completeness, or suitability of any content or products presented. Nothing on this website should be construed as legal, tax, investment, financial, medical, or other professional advice. In addition, no part of this site—including articles or product references—constitutes a solicitation, recommendation, endorsement, advertisement, or offer to buy or sell any securities, franchises, or other financial instruments, particularly in jurisdictions where such activity would be unlawful.
All content is of a general nature and may not address the specific circumstances of any individual or entity. It is not a substitute for professional advice or services. Any actions you take based on the information provided here are strictly at your own risk. You accept full responsibility for any decisions or outcomes arising from your use of this website and agree to release us from any liability in connection with your use of, or reliance upon, the content or products found herein.