
|
Fujian Funeng Co., Ltd. (600483.SS) DCF Valuation |
Fully Editable: Tailor To Your Needs In Excel Or Sheets
Professional Design: Trusted, Industry-Standard Templates
Investor-Approved Valuation Models
MAC/PC Compatible, Fully Unlocked
No Expertise Is Needed; Easy To Follow
Fujian Funeng Co., Ltd. (600483.SS) Bundle
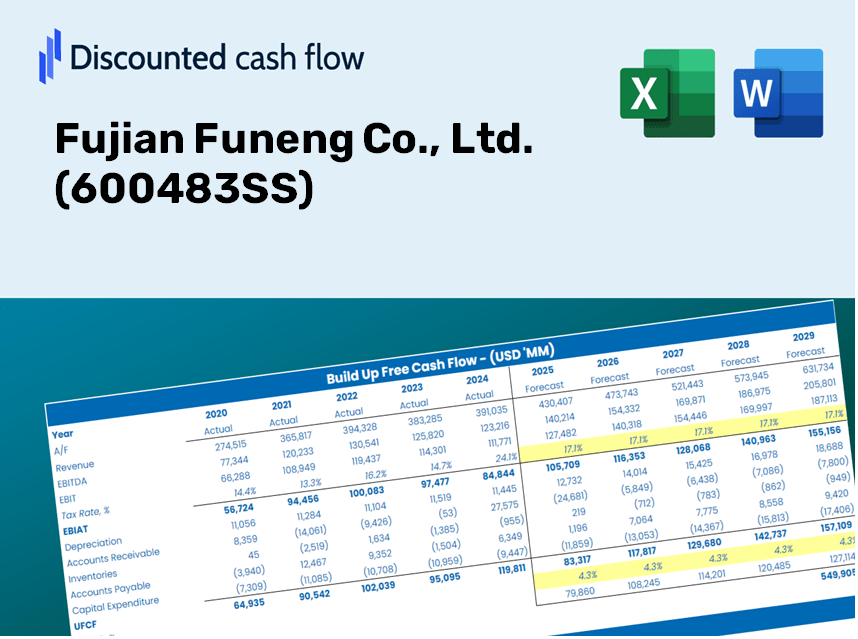
For both investors and analysts, this (600483SS) DCF Calculator serves as the perfect resource for accurate valuation. Featuring real data from Fujian Funeng Co., Ltd., you can adjust forecasts and observe the effects in real time.
Discounted Cash Flow (DCF) - (USD MM)
| Year | AY1 2020 |
AY2 2021 |
AY3 2022 |
AY4 2023 |
AY5 2024 |
FY1 2025 |
FY2 2026 |
FY3 2027 |
FY4 2028 |
FY5 2029 |
|---|---|---|---|---|---|---|---|---|---|---|
| Revenue | 9,557.4 | 12,155.9 | 14,317.9 | 14,694.9 | 14,563.3 | 16,263.9 | 18,163.2 | 20,284.3 | 22,653.0 | 25,298.3 |
| Revenue Growth, % | 0 | 27.19 | 17.79 | 2.63 | -0.89578 | 11.68 | 11.68 | 11.68 | 11.68 | 11.68 |
| EBITDA | 3,102.5 | 3,058.7 | 4,601.6 | 4,909.7 | 5,119.2 | 5,150.0 | 5,751.4 | 6,423.0 | 7,173.1 | 8,010.7 |
| EBITDA, % | 32.46 | 25.16 | 32.14 | 33.41 | 35.15 | 31.67 | 31.67 | 31.67 | 31.67 | 31.67 |
| Depreciation | 1,126.1 | 1,275.6 | 1,595.6 | 1,884.8 | 1,812.3 | 1,909.1 | 2,132.0 | 2,381.0 | 2,659.0 | 2,969.5 |
| Depreciation, % | 11.78 | 10.49 | 11.14 | 12.83 | 12.44 | 11.74 | 11.74 | 11.74 | 11.74 | 11.74 |
| EBIT | 1,976.4 | 1,783.2 | 3,006.0 | 3,025.0 | 3,306.9 | 3,240.9 | 3,619.4 | 4,042.0 | 4,514.1 | 5,041.2 |
| EBIT, % | 20.68 | 14.67 | 21 | 20.59 | 22.71 | 19.93 | 19.93 | 19.93 | 19.93 | 19.93 |
| Total Cash | 2,100.8 | 2,915.1 | 3,972.3 | 5,830.9 | 5,645.2 | 4,949.1 | 5,527.0 | 6,172.5 | 6,893.3 | 7,698.2 |
| Total Cash, percent | .0 | .0 | .0 | .0 | .0 | .0 | .0 | .0 | .0 | .0 |
| Account Receivables | 2,881.4 | 3,101.5 | 4,633.6 | 4,892.5 | 5,616.7 | 5,200.8 | 5,808.1 | 6,486.4 | 7,243.8 | 8,089.8 |
| Account Receivables, % | 30.15 | 25.51 | 32.36 | 33.29 | 38.57 | 31.98 | 31.98 | 31.98 | 31.98 | 31.98 |
| Inventories | 445.2 | 529.0 | 695.5 | 664.2 | 583.3 | 728.4 | 813.4 | 908.4 | 1,014.5 | 1,132.9 |
| Inventories, % | 4.66 | 4.35 | 4.86 | 4.52 | 4.01 | 4.48 | 4.48 | 4.48 | 4.48 | 4.48 |
| Accounts Payable | 1,287.7 | 2,719.6 | 3,666.5 | 2,201.7 | 1,455.6 | 2,811.4 | 3,139.7 | 3,506.3 | 3,915.8 | 4,373.1 |
| Accounts Payable, % | 13.47 | 22.37 | 25.61 | 14.98 | 9.99 | 17.29 | 17.29 | 17.29 | 17.29 | 17.29 |
| Capital Expenditure | -4,779.2 | -6,448.4 | -1,830.9 | -2,075.7 | -3,243.0 | -4,951.9 | -5,530.1 | -6,175.9 | -6,897.1 | -7,702.6 |
| Capital Expenditure, % | -50.01 | -53.05 | -12.79 | -14.13 | -22.27 | -30.45 | -30.45 | -30.45 | -30.45 | -30.45 |
| Tax Rate, % | 31.14 | 31.14 | 31.14 | 31.14 | 31.14 | 31.14 | 31.14 | 31.14 | 31.14 | 31.14 |
| EBITAT | 1,585.9 | 1,347.0 | 2,151.6 | 2,185.7 | 2,277.1 | 2,388.4 | 2,667.3 | 2,978.8 | 3,326.7 | 3,715.1 |
| Depreciation | ||||||||||
| Changes in Account Receivables | ||||||||||
| Changes in Inventories | ||||||||||
| Changes in Accounts Payable | ||||||||||
| Capital Expenditure | ||||||||||
| UFCF | -4,106.1 | -2,697.8 | 1,164.5 | 302.4 | -543.0 | 972.3 | -1,094.9 | -1,222.7 | -1,365.5 | -1,525.0 |
| WACC, % | 3.98 | 3.92 | 3.87 | 3.88 | 3.83 | 3.89 | 3.89 | 3.89 | 3.89 | 3.89 |
| PV UFCF | ||||||||||
| SUM PV UFCF | -3,600.6 | |||||||||
| Long Term Growth Rate, % | 2.00 | |||||||||
| Free cash flow (T + 1) | -1,555 | |||||||||
| Terminal Value | -82,099 | |||||||||
| Present Terminal Value | -67,822 | |||||||||
| Enterprise Value | -71,423 | |||||||||
| Net Debt | 9,351 | |||||||||
| Equity Value | -80,774 | |||||||||
| Diluted Shares Outstanding, MM | 2,793 | |||||||||
| Equity Value Per Share | -28.92 |
What You Will Receive
- Authentic Fujian Funeng Data: Preloaded financial metrics – including revenue and EBIT – derived from actual and forecasted figures.
- Comprehensive Customization: Modify all essential parameters (yellow cells) such as WACC, growth %, and tax rates.
- Real-Time Valuation Adjustments: Automatic recalculations to assess the effects of changes on Fujian Funeng’s fair value.
- Flexible Excel Template: Designed for easy modifications, scenario analysis, and in-depth projections.
- Efficiency and Precision: Avoid starting models from scratch while ensuring accuracy and adaptability.
Core Features
- Comprehensive Historical Data: Access Fujian Funeng Co., Ltd.'s past financial statements and pre-populated forecasts.
- Customizable Variables: Adjust inputs such as WACC, tax rates, revenue growth, and EBITDA margins as needed.
- Real-Time Insights: Track the intrinsic value of Fujian Funeng Co., Ltd. recalculating live.
- Visual Performance Metrics: Interactive dashboard displays valuation outcomes and essential metrics.
- Designed for Precision: A robust tool tailored for analysts, investors, and finance professionals.
How It Works
- Step 1: Download the ready-to-use Excel template containing Fujian Funeng Co., Ltd. data.
- Step 2: Review the pre-filled worksheets to familiarize yourself with the essential metrics.
- Step 3: Modify forecasts and assumptions in the editable yellow cells (WACC, growth, margins).
- Step 4: Instantly see the updated results, including the intrinsic value of Fujian Funeng Co., Ltd. (600483SS).
- Step 5: Make informed investment choices or create reports based on the generated outputs.
Reasons to Choose Fujian Funeng Co., Ltd. (600483SS) Calculator
- All-in-One Solution: Features DCF, WACC, and financial ratio analyses seamlessly integrated.
- Flexible Adjustments: Modify the highlighted cells to explore different financial scenarios.
- In-Depth Analysis: Automatically computes the intrinsic value and Net Present Value for Fujian Funeng Co., Ltd.
- Loaded with Relevant Data: Comes with historical and projected data to provide reliable starting points.
- Designed for Professionals: Perfect for financial analysts, investors, and business consultants seeking detailed insights.
Who Can Benefit from Fujian Funeng Co., Ltd. (600483SS)?
- Investors: Utilize an advanced valuation tool to make informed investment choices.
- Financial Analysts: Streamline your analysis with a customizable DCF model built for efficiency.
- Consultants: Easily modify the template for impactful client presentations and reports.
- Finance Enthusiasts: Enhance your knowledge of valuation methodologies through practical, real-world applications.
- Educators and Students: Leverage this tool as a hands-on resource in finance-related educational programs.
Contents of the Template
- Pre-Filled Data: Comprehensive historical financials and projections for Fujian Funeng Co., Ltd. (600483SS).
- Discounted Cash Flow Model: An editable DCF valuation model featuring automatic calculations.
- Weighted Average Cost of Capital (WACC): A specific sheet dedicated to calculating WACC using customizable inputs.
- Key Financial Ratios: Insights into Fujian Funeng's profitability, efficiency, and leverage metrics.
- Customizable Inputs: Easily modify revenue growth rates, profit margins, and tax percentages.
- Clear Dashboard: Visual presentations including charts and tables that summarize essential valuation outcomes.
Disclaimer
All information, articles, and product details provided on this website are for general informational and educational purposes only. We do not claim any ownership over, nor do we intend to infringe upon, any trademarks, copyrights, logos, brand names, or other intellectual property mentioned or depicted on this site. Such intellectual property remains the property of its respective owners, and any references here are made solely for identification or informational purposes, without implying any affiliation, endorsement, or partnership.
We make no representations or warranties, express or implied, regarding the accuracy, completeness, or suitability of any content or products presented. Nothing on this website should be construed as legal, tax, investment, financial, medical, or other professional advice. In addition, no part of this site—including articles or product references—constitutes a solicitation, recommendation, endorsement, advertisement, or offer to buy or sell any securities, franchises, or other financial instruments, particularly in jurisdictions where such activity would be unlawful.
All content is of a general nature and may not address the specific circumstances of any individual or entity. It is not a substitute for professional advice or services. Any actions you take based on the information provided here are strictly at your own risk. You accept full responsibility for any decisions or outcomes arising from your use of this website and agree to release us from any liability in connection with your use of, or reliance upon, the content or products found herein.