
|
Changjiang & Jinggong Steel Building Co., Ltd (600496.SS) DCF Valuation |
Fully Editable: Tailor To Your Needs In Excel Or Sheets
Professional Design: Trusted, Industry-Standard Templates
Investor-Approved Valuation Models
MAC/PC Compatible, Fully Unlocked
No Expertise Is Needed; Easy To Follow
Changjiang & Jinggong Steel Building (Group) Co., Ltd (600496.SS) Bundle
Gain insight into your Changjiang & Jinggong Steel Building (Group) Co., Ltd (600496SS) valuation analysis with our sophisticated DCF Calculator! This Excel template comes preloaded with real (600496SS) data, enabling you to adjust forecasts and assumptions to accurately determine the intrinsic value of Changjiang & Jinggong Steel Building (Group) Co., Ltd.
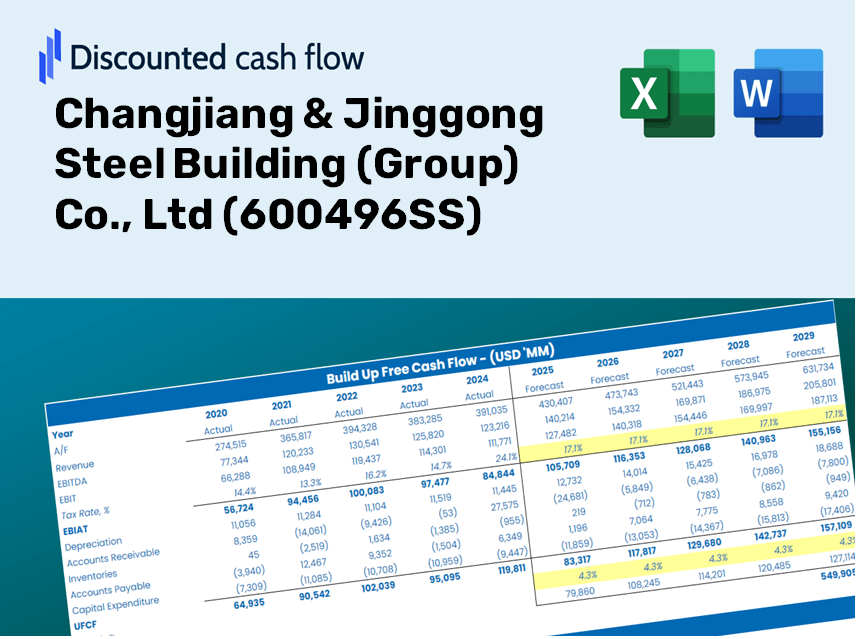
Discounted Cash Flow (DCF) - (USD MM)
| Year | AY1 2020 |
AY2 2021 |
AY3 2022 |
AY4 2023 |
AY5 2024 |
FY1 2025 |
FY2 2026 |
FY3 2027 |
FY4 2028 |
FY5 2029 |
|---|---|---|---|---|---|---|---|---|---|---|
| Revenue | 11,484.0 | 15,141.4 | 15,714.9 | 16,506.4 | 18,492.1 | 20,928.5 | 23,685.8 | 26,806.5 | 30,338.4 | 34,335.6 |
| Revenue Growth, % | 0 | 31.85 | 3.79 | 5.04 | 12.03 | 13.18 | 13.18 | 13.18 | 13.18 | 13.18 |
| EBITDA | 778.9 | 812.8 | 866.8 | 711.9 | 805.3 | 1,102.3 | 1,247.5 | 1,411.9 | 1,597.9 | 1,808.4 |
| EBITDA, % | 6.78 | 5.37 | 5.52 | 4.31 | 4.35 | 5.27 | 5.27 | 5.27 | 5.27 | 5.27 |
| Depreciation | 102.1 | 106.3 | 129.4 | 144.5 | 170.7 | 176.3 | 199.6 | 225.9 | 255.6 | 289.3 |
| Depreciation, % | 0.88886 | 0.70194 | 0.82348 | 0.87558 | 0.92318 | 0.84261 | 0.84261 | 0.84261 | 0.84261 | 0.84261 |
| EBIT | 676.8 | 706.6 | 737.4 | 567.4 | 634.6 | 925.9 | 1,047.9 | 1,186.0 | 1,342.3 | 1,519.1 |
| EBIT, % | 5.89 | 4.67 | 4.69 | 3.44 | 3.43 | 4.42 | 4.42 | 4.42 | 4.42 | 4.42 |
| Total Cash | 3,135.5 | 2,766.2 | 4,410.7 | 4,578.2 | 5,391.3 | 5,463.6 | 6,183.4 | 6,998.1 | 7,920.1 | 8,963.6 |
| Total Cash, percent | .0 | .0 | .0 | .0 | .0 | .0 | .0 | .0 | .0 | .0 |
| Account Receivables | 7,006.5 | 8,625.1 | 10,676.4 | 12,238.9 | 13,676.6 | 13,981.0 | 15,823.1 | 17,907.8 | 20,267.2 | 22,937.5 |
| Account Receivables, % | 61.01 | 56.96 | 67.94 | 74.15 | 73.96 | 66.8 | 66.8 | 66.8 | 66.8 | 66.8 |
| Inventories | 1,087.9 | 1,359.5 | 1,327.2 | 1,431.1 | 1,588.5 | 1,848.3 | 2,091.8 | 2,367.4 | 2,679.3 | 3,032.3 |
| Inventories, % | 9.47 | 8.98 | 8.45 | 8.67 | 8.59 | 8.83 | 8.83 | 8.83 | 8.83 | 8.83 |
| Accounts Payable | 5,301.3 | 6,099.9 | 7,527.7 | 8,857.0 | 10,225.5 | 10,184.0 | 11,525.8 | 13,044.4 | 14,763.0 | 16,708.1 |
| Accounts Payable, % | 46.16 | 40.29 | 47.9 | 53.66 | 55.3 | 48.66 | 48.66 | 48.66 | 48.66 | 48.66 |
| Capital Expenditure | -74.4 | -202.1 | -556.2 | -253.6 | -117.9 | -322.1 | -364.5 | -412.6 | -466.9 | -528.4 |
| Capital Expenditure, % | -0.64757 | -1.33 | -3.54 | -1.54 | -0.63741 | -1.54 | -1.54 | -1.54 | -1.54 | -1.54 |
| Tax Rate, % | 11.34 | 11.34 | 11.34 | 11.34 | 11.34 | 11.34 | 11.34 | 11.34 | 11.34 | 11.34 |
| EBITAT | 648.2 | 673.3 | 703.6 | 522.9 | 562.6 | 865.4 | 979.4 | 1,108.4 | 1,254.5 | 1,419.8 |
| Depreciation | ||||||||||
| Changes in Account Receivables | ||||||||||
| Changes in Inventories | ||||||||||
| Changes in Accounts Payable | ||||||||||
| Capital Expenditure | ||||||||||
| UFCF | -2,117.2 | -514.1 | -314.4 | 76.7 | 388.9 | 113.9 | 70.7 | 80.0 | 90.5 | 102.4 |
| WACC, % | 4.98 | 4.97 | 4.98 | 4.92 | 4.87 | 4.94 | 4.94 | 4.94 | 4.94 | 4.94 |
| PV UFCF | ||||||||||
| SUM PV UFCF | 397.0 | |||||||||
| Long Term Growth Rate, % | 3.00 | |||||||||
| Free cash flow (T + 1) | 105 | |||||||||
| Terminal Value | 5,425 | |||||||||
| Present Terminal Value | 4,262 | |||||||||
| Enterprise Value | 4,659 | |||||||||
| Net Debt | -1,998 | |||||||||
| Equity Value | 6,657 | |||||||||
| Diluted Shares Outstanding, MM | 2,104 | |||||||||
| Equity Value Per Share | 3.16 |
Benefits You Will Receive
- Pre-Loaded Financial Model: Real data from Changjiang & Jinggong Steel Building (Group) Co., Ltd (600496SS) allows for accurate DCF valuation.
- Comprehensive Forecast Control: Tailor revenue growth, profit margins, WACC, and other critical factors as needed.
- Real-Time Calculations: Automatic updates provide immediate feedback as you adjust inputs.
- Investor-Ready Format: A polished Excel template crafted for professional valuation standards.
- Flexible and Reusable: Designed for adaptability, enabling you to create detailed forecasts repeatedly.
Key Features
- Comprehensive DCF Calculator: Features detailed unlevered and levered DCF valuation models tailored for Changjiang & Jinggong Steel Building (Group) Co., Ltd (600496SS).
- WACC Calculator: Equipped with a pre-built Weighted Average Cost of Capital sheet that allows for customizable inputs.
- Adjustable Forecast Assumptions: Easily modify growth rates, capital expenditures, and discount rates to fit your analysis.
- Integrated Financial Ratios: Evaluate profitability, leverage, and efficiency ratios specific to Changjiang & Jinggong Steel Building (Group) Co., Ltd (600496SS).
- Interactive Dashboard and Charts: Visual representations summarize essential valuation metrics for straightforward analysis.
How It Works
- Step 1: Download the Excel file.
- Step 2: Review pre-filled data for Changjiang & Jinggong Steel Building (Group) Co., Ltd (600496SS), including historical figures and future projections.
- Step 3: Modify key assumptions (highlighted in yellow) according to your analysis.
- Step 4: Observe automatic recalculations for the intrinsic value of Changjiang & Jinggong Steel Building (Group) Co., Ltd (600496SS).
- Step 5: Utilize the results for making investment decisions or for reporting purposes.
Why Opt for Our Calculator?
- Efficient Use of Time: Skip the hassle of building a DCF model from the ground up – it’s immediately accessible.
- Enhanced Accuracy: Dependable financial data and formulas minimize valuation errors.
- Completely Customizable: Adjust the model to align with your unique assumptions and forecasts.
- User-Friendly: Intuitive charts and outputs simplify the analysis of results.
- Preferred by Professionals: Crafted for experts at Changjiang & Jinggong Steel Building (Group) Co., Ltd (600496SS) who prioritize accuracy and usability.
Who Can Benefit from This Product?
- Professional Investors: Develop precise and trustworthy valuation models for analyzing investment portfolios in Changjiang & Jinggong Steel Building (Group) Co., Ltd (600496SS).
- Corporate Finance Teams: Examine valuation scenarios to inform strategic decisions within their organizations.
- Consultants and Advisors: Offer clients in-depth valuation analysis and insights related to Changjiang & Jinggong Steel Building (Group) Co., Ltd (600496SS).
- Students and Educators: Utilize real market data to enhance learning and practice in financial modeling techniques.
- Industry Enthusiasts: Gain insights into the valuation practices of key players in the steel building sector, including Changjiang & Jinggong Steel Building (Group) Co., Ltd (600496SS).
Contents of the Template
- Historical Data: Comprehensive overview of Changjiang & Jinggong Steel Building (Group) Co., Ltd's past financial performance and foundational forecasts.
- DCF and Levered DCF Models: In-depth templates for assessing the intrinsic value of Changjiang & Jinggong Steel Building (Group) Co., Ltd.
- WACC Sheet: Ready-to-use calculations for Weighted Average Cost of Capital.
- Editable Inputs: Customize key variables such as growth rates, EBITDA percentages, and CAPEX assumptions.
- Quarterly and Annual Statements: Detailed analysis of Changjiang & Jinggong Steel Building (Group) Co., Ltd's financial statements.
- Interactive Dashboard: Dynamic visualization of valuation outcomes and future projections.
Disclaimer
All information, articles, and product details provided on this website are for general informational and educational purposes only. We do not claim any ownership over, nor do we intend to infringe upon, any trademarks, copyrights, logos, brand names, or other intellectual property mentioned or depicted on this site. Such intellectual property remains the property of its respective owners, and any references here are made solely for identification or informational purposes, without implying any affiliation, endorsement, or partnership.
We make no representations or warranties, express or implied, regarding the accuracy, completeness, or suitability of any content or products presented. Nothing on this website should be construed as legal, tax, investment, financial, medical, or other professional advice. In addition, no part of this site—including articles or product references—constitutes a solicitation, recommendation, endorsement, advertisement, or offer to buy or sell any securities, franchises, or other financial instruments, particularly in jurisdictions where such activity would be unlawful.
All content is of a general nature and may not address the specific circumstances of any individual or entity. It is not a substitute for professional advice or services. Any actions you take based on the information provided here are strictly at your own risk. You accept full responsibility for any decisions or outcomes arising from your use of this website and agree to release us from any liability in connection with your use of, or reliance upon, the content or products found herein.