
|
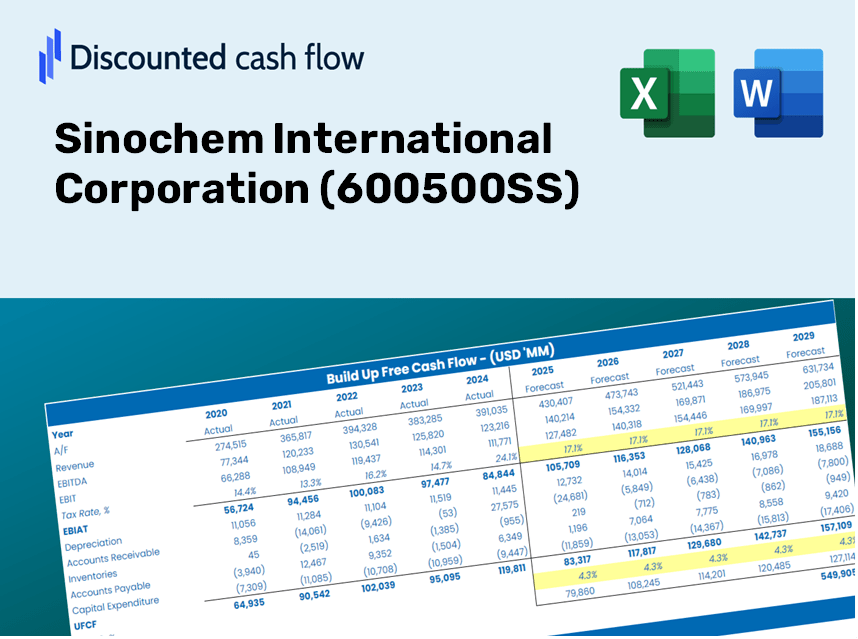
Sinochem International Corporation (600500.SS) DCF Valuation |
Fully Editable: Tailor To Your Needs In Excel Or Sheets
Professional Design: Trusted, Industry-Standard Templates
Investor-Approved Valuation Models
MAC/PC Compatible, Fully Unlocked
No Expertise Is Needed; Easy To Follow
Sinochem International Corporation (600500.SS) Bundle
Looking to determine the intrinsic value of Sinochem International Corporation? Our (600500SS) DCF Calculator merges practical data with extensive customization features, allowing you to refine your projections and enhance your investment choices.
Discounted Cash Flow (DCF) - (USD MM)
| Year | AY1 2020 |
AY2 2021 |
AY3 2022 |
AY4 2023 |
AY5 2024 |
FY1 2025 |
FY2 2026 |
FY3 2027 |
FY4 2028 |
FY5 2029 |
|---|---|---|---|---|---|---|---|---|---|---|
| Revenue | 54,161.9 | 80,782.4 | 87,449.0 | 54,272.3 | 52,925.3 | 55,172.2 | 57,514.6 | 59,956.3 | 62,501.8 | 65,155.3 |
| Revenue Growth, % | 0 | 49.15 | 8.25 | -37.94 | -2.48 | 4.25 | 4.25 | 4.25 | 4.25 | 4.25 |
| EBITDA | 3,988.2 | 4,864.2 | 4,291.9 | 946.7 | 575.3 | 2,330.9 | 2,429.9 | 2,533.1 | 2,640.6 | 2,752.7 |
| EBITDA, % | 7.36 | 6.02 | 4.91 | 1.74 | 1.09 | 4.22 | 4.22 | 4.22 | 4.22 | 4.22 |
| Depreciation | 1,568.3 | 1,507.5 | 1,615.9 | 2,138.2 | 2,380.8 | 1,660.4 | 1,730.9 | 1,804.4 | 1,881.0 | 1,960.9 |
| Depreciation, % | 2.9 | 1.87 | 1.85 | 3.94 | 4.5 | 3.01 | 3.01 | 3.01 | 3.01 | 3.01 |
| EBIT | 2,419.9 | 3,356.7 | 2,676.0 | -1,191.5 | -1,805.4 | 670.5 | 699.0 | 728.7 | 759.6 | 791.8 |
| EBIT, % | 4.47 | 4.16 | 3.06 | -2.2 | -3.41 | 1.22 | 1.22 | 1.22 | 1.22 | 1.22 |
| Total Cash | 6,925.9 | 2,979.5 | 4,585.2 | 1,913.3 | 3,152.3 | 3,442.8 | 3,589.0 | 3,741.3 | 3,900.2 | 4,065.8 |
| Total Cash, percent | .0 | .0 | .0 | .0 | .0 | .0 | .0 | .0 | .0 | .0 |
| Account Receivables | 8,626.1 | 9,088.9 | 8,288.5 | 7,165.9 | 6,016.9 | 6,756.2 | 7,043.0 | 7,342.0 | 7,653.7 | 7,978.6 |
| Account Receivables, % | 15.93 | 11.25 | 9.48 | 13.2 | 11.37 | 12.25 | 12.25 | 12.25 | 12.25 | 12.25 |
| Inventories | 6,556.5 | 7,594.5 | 6,015.4 | 4,247.5 | 3,988.1 | 4,827.2 | 5,032.2 | 5,245.8 | 5,468.5 | 5,700.7 |
| Inventories, % | 12.11 | 9.4 | 6.88 | 7.83 | 7.54 | 8.75 | 8.75 | 8.75 | 8.75 | 8.75 |
| Accounts Payable | 5,565.5 | 6,403.3 | 7,934.1 | 8,251.2 | 7,549.0 | 6,261.2 | 6,527.0 | 6,804.1 | 7,093.0 | 7,394.1 |
| Accounts Payable, % | 10.28 | 7.93 | 9.07 | 15.2 | 14.26 | 11.35 | 11.35 | 11.35 | 11.35 | 11.35 |
| Capital Expenditure | -4,824.3 | -8,656.0 | -8,331.9 | -4,279.0 | -2,270.5 | -4,559.9 | -4,753.5 | -4,955.3 | -5,165.7 | -5,385.0 |
| Capital Expenditure, % | -8.91 | -10.72 | -9.53 | -7.88 | -4.29 | -8.26 | -8.26 | -8.26 | -8.26 | -8.26 |
| Tax Rate, % | 7.21 | 7.21 | 7.21 | 7.21 | 7.21 | 7.21 | 7.21 | 7.21 | 7.21 | 7.21 |
| EBITAT | 341.5 | 754.3 | 1,343.7 | -1,030.9 | -1,675.2 | 356.9 | 372.0 | 387.8 | 404.3 | 421.4 |
| Depreciation | ||||||||||
| Changes in Account Receivables | ||||||||||
| Changes in Inventories | ||||||||||
| Changes in Accounts Payable | ||||||||||
| Capital Expenditure | ||||||||||
| UFCF | -12,531.7 | -7,057.2 | -1,461.9 | 35.8 | -858.7 | -5,408.9 | -2,876.5 | -2,998.7 | -3,126.0 | -3,258.7 |
| WACC, % | 3.49 | 3.67 | 4.26 | 5.04 | 5.18 | 4.33 | 4.33 | 4.33 | 4.33 | 4.33 |
| PV UFCF | ||||||||||
| SUM PV UFCF | -15,743.2 | |||||||||
| Long Term Growth Rate, % | 1.00 | |||||||||
| Free cash flow (T + 1) | -3,291 | |||||||||
| Terminal Value | -98,899 | |||||||||
| Present Terminal Value | -80,018 | |||||||||
| Enterprise Value | -95,761 | |||||||||
| Net Debt | 13,864 | |||||||||
| Equity Value | -109,625 | |||||||||
| Diluted Shares Outstanding, MM | 3,591 | |||||||||
| Equity Value Per Share | -30.53 |
What You'll Receive
- Adjustable Forecast Parameters: Effortlessly modify assumptions (growth %, margins, WACC) to generate various scenarios.
- Comprehensive Data: Sinochem International Corporation's financial data pre-loaded to facilitate your analysis.
- Automated DCF Calculations: The model computes Net Present Value (NPV) and intrinsic value automatically.
- Customizable and Professional Design: A refined Excel model tailored to meet your valuation requirements.
- Designed for Analysts and Investors: Perfect for evaluating projections, confirming strategies, and enhancing efficiency.
Key Features
- Authentic Sinochem Financials: Access precise historical data and future forecasts seamlessly.
- Customizable Forecast Inputs: Modify highlighted cells for WACC, growth rates, and profit margins.
- Real-Time Calculations: Automatic updates for DCF, Net Present Value (NPV), and cash flow assessments.
- Interactive Dashboard: Clear charts and summaries for visualizing your valuation outcomes.
- Designed for All Users: An intuitive layout catering to investors, CFOs, and consultants alike.
How It Functions
- Step 1: Download the Excel file.
- Step 2: Review the pre-filled financial data and forecasts for Sinochem International Corporation (600500SS).
- Step 3: Adjust key inputs such as revenue growth, WACC, and tax rates (highlighted cells).
- Step 4: Observe the DCF model update in real-time as you modify your assumptions.
- Step 5: Evaluate the outputs and utilize the results for your investment strategies.
Why Opt for This Calculator?
- Designed for Experts: A sophisticated tool utilized by analysts, CFOs, and consultants.
- Accurate Financial Data: Sinochem International Corporation’s historical and projected financials preloaded for precision.
- Scenario Analysis: Effortlessly test various forecasts and assumptions.
- Transparent Results: Automatically computes intrinsic value, NPV, and essential metrics.
- User-Friendly: Detailed instructions guide you through each step of the process.
Who Can Benefit from This Product?
- Investors: Accurately assess Sinochem International Corporation's fair value before making investment choices.
- CFOs: Utilize a professional-grade DCF model for financial reporting and analysis specific to (600500SS).
- Consultants: Seamlessly customize the template for valuation reports tailored to clients focusing on (600500SS).
- Entrepreneurs: Discover insights into the financial modeling practices of leading corporations, including (600500SS).
- Educators: Employ it as a teaching aid to illustrate various valuation methodologies related to (600500SS).
Contents of the Template
- Pre-Filled Data: Contains historical financial data and forecasts for Sinochem International Corporation (600500SS).
- Discounted Cash Flow Model: An editable DCF valuation model featuring automatic calculations.
- Weighted Average Cost of Capital (WACC): A dedicated worksheet to compute WACC using user-defined inputs.
- Key Financial Ratios: Evaluate Sinochem's profitability, efficiency, and financial leverage.
- Customizable Inputs: Easily modify revenue growth, margins, and tax rates.
- Clear Dashboard: Visualizations and tables summarizing key valuation findings.
Disclaimer
All information, articles, and product details provided on this website are for general informational and educational purposes only. We do not claim any ownership over, nor do we intend to infringe upon, any trademarks, copyrights, logos, brand names, or other intellectual property mentioned or depicted on this site. Such intellectual property remains the property of its respective owners, and any references here are made solely for identification or informational purposes, without implying any affiliation, endorsement, or partnership.
We make no representations or warranties, express or implied, regarding the accuracy, completeness, or suitability of any content or products presented. Nothing on this website should be construed as legal, tax, investment, financial, medical, or other professional advice. In addition, no part of this site—including articles or product references—constitutes a solicitation, recommendation, endorsement, advertisement, or offer to buy or sell any securities, franchises, or other financial instruments, particularly in jurisdictions where such activity would be unlawful.
All content is of a general nature and may not address the specific circumstances of any individual or entity. It is not a substitute for professional advice or services. Any actions you take based on the information provided here are strictly at your own risk. You accept full responsibility for any decisions or outcomes arising from your use of this website and agree to release us from any liability in connection with your use of, or reliance upon, the content or products found herein.