
|
Tongling Jingda Special Magnet Wire Co., Ltd. (600577.SS) DCF Valuation |
Fully Editable: Tailor To Your Needs In Excel Or Sheets
Professional Design: Trusted, Industry-Standard Templates
Investor-Approved Valuation Models
MAC/PC Compatible, Fully Unlocked
No Expertise Is Needed; Easy To Follow
Tongling Jingda Special Magnet Wire Co., Ltd. (600577.SS) Bundle
Explore the financial future of Tongling Jingda Special Magnet Wire Co., Ltd. (600577SS) with our user-friendly DCF Calculator! Enter your projections for growth, margins, and costs to determine the intrinsic value of Tongling Jingda Special Magnet Wire Co., Ltd. (600577SS) and enhance your investment strategy.
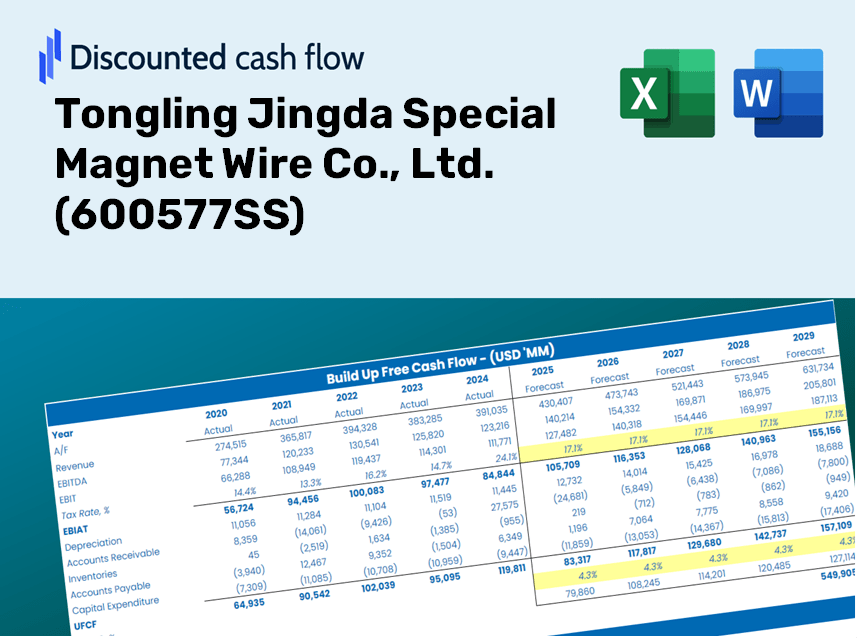
Discounted Cash Flow (DCF) - (USD MM)
| Year | AY1 2020 |
AY2 2021 |
AY3 2022 |
AY4 2023 |
AY5 2024 |
FY1 2025 |
FY2 2026 |
FY3 2027 |
FY4 2028 |
FY5 2029 |
|---|---|---|---|---|---|---|---|---|---|---|
| Revenue | 12,446.9 | 18,329.8 | 17,542.4 | 17,905.9 | 22,322.6 | 23,247.6 | 24,211.0 | 25,214.3 | 26,259.2 | 27,347.4 |
| Revenue Growth, % | 0 | 47.26 | -4.3 | 2.07 | 24.67 | 4.14 | 4.14 | 4.14 | 4.14 | 4.14 |
| EBITDA | 789.9 | 1,025.2 | 747.7 | 785.5 | 976.6 | 1,160.7 | 1,208.8 | 1,258.9 | 1,311.0 | 1,365.4 |
| EBITDA, % | 6.35 | 5.59 | 4.26 | 4.39 | 4.37 | 4.99 | 4.99 | 4.99 | 4.99 | 4.99 |
| Depreciation | 121.8 | 123.9 | 131.6 | 147.9 | 162.9 | 184.1 | 191.8 | 199.7 | 208.0 | 216.6 |
| Depreciation, % | 0.97874 | 0.67579 | 0.75031 | 0.82572 | 0.72953 | 0.79202 | 0.79202 | 0.79202 | 0.79202 | 0.79202 |
| EBIT | 668.1 | 901.4 | 616.1 | 637.7 | 813.7 | 976.6 | 1,017.0 | 1,059.2 | 1,103.1 | 1,148.8 |
| EBIT, % | 5.37 | 4.92 | 3.51 | 3.56 | 3.65 | 4.2 | 4.2 | 4.2 | 4.2 | 4.2 |
| Total Cash | 1,558.9 | 1,538.1 | 1,959.2 | 1,896.5 | 1,117.6 | 2,217.0 | 2,308.9 | 2,404.5 | 2,504.2 | 2,608.0 |
| Total Cash, percent | .0 | .0 | .0 | .0 | .0 | .0 | .0 | .0 | .0 | .0 |
| Account Receivables | 4,322.7 | 4,720.4 | 4,639.4 | 4,925.8 | 6,354.9 | 6,644.5 | 6,919.8 | 7,206.6 | 7,505.2 | 7,816.2 |
| Account Receivables, % | 34.73 | 25.75 | 26.45 | 27.51 | 28.47 | 28.58 | 28.58 | 28.58 | 28.58 | 28.58 |
| Inventories | 1,216.1 | 1,642.7 | 1,480.0 | 1,601.6 | 1,780.1 | 2,049.9 | 2,134.8 | 2,223.3 | 2,315.4 | 2,411.4 |
| Inventories, % | 9.77 | 8.96 | 8.44 | 8.94 | 7.97 | 8.82 | 8.82 | 8.82 | 8.82 | 8.82 |
| Accounts Payable | 1,324.5 | 1,225.3 | 1,451.2 | 1,802.5 | 1,627.8 | 1,997.3 | 2,080.1 | 2,166.3 | 2,256.1 | 2,349.5 |
| Accounts Payable, % | 10.64 | 6.68 | 8.27 | 10.07 | 7.29 | 8.59 | 8.59 | 8.59 | 8.59 | 8.59 |
| Capital Expenditure | -183.6 | -409.7 | -456.7 | -329.9 | -157.7 | -412.1 | -429.1 | -446.9 | -465.4 | -484.7 |
| Capital Expenditure, % | -1.47 | -2.24 | -2.6 | -1.84 | -0.7063 | -1.77 | -1.77 | -1.77 | -1.77 | -1.77 |
| Tax Rate, % | 23.78 | 23.78 | 23.78 | 23.78 | 23.78 | 23.78 | 23.78 | 23.78 | 23.78 | 23.78 |
| EBITAT | 449.3 | 624.8 | 456.2 | 484.8 | 620.2 | 708.7 | 738.1 | 768.7 | 800.5 | 833.7 |
| Depreciation | ||||||||||
| Changes in Account Receivables | ||||||||||
| Changes in Inventories | ||||||||||
| Changes in Accounts Payable | ||||||||||
| Capital Expenditure | ||||||||||
| UFCF | -3,826.7 | -584.6 | 600.6 | 246.2 | -1,157.0 | 290.9 | 223.2 | 232.4 | 242.1 | 252.1 |
| WACC, % | 8.07 | 8.08 | 8.11 | 8.12 | 8.12 | 8.1 | 8.1 | 8.1 | 8.1 | 8.1 |
| PV UFCF | ||||||||||
| SUM PV UFCF | 992.3 | |||||||||
| Long Term Growth Rate, % | 3.50 | |||||||||
| Free cash flow (T + 1) | 261 | |||||||||
| Terminal Value | 5,676 | |||||||||
| Present Terminal Value | 3,846 | |||||||||
| Enterprise Value | 4,838 | |||||||||
| Net Debt | 3,001 | |||||||||
| Equity Value | 1,837 | |||||||||
| Diluted Shares Outstanding, MM | 2,160 | |||||||||
| Equity Value Per Share | 0.85 |
What You Will Receive
- Authentic TJS Financial Data: Pre-loaded with Tongling Jingda's historical and forecasted figures for accurate analysis.
- Completely Customizable Template: Easily adjust essential inputs such as revenue growth, WACC, and EBITDA margin.
- Instant Calculations: Watch the intrinsic value of TJS update in real-time as you make changes.
- Professional Valuation Tool: Tailored for investors, analysts, and consultants aiming for precise DCF outcomes.
- User-Friendly Interface: Clear layout and straightforward instructions suitable for all levels of experience.
Key Features
- Authentic Financial Data: Gain access to reliable historical data and future forecasts tailored for Tongling Jingda Special Magnet Wire Co., Ltd. (600577SS).
- Adjustable Forecast Metrics: Modify highlighted parameters such as WACC, growth rates, and profit margins.
- Real-Time Calculations: Automatic updates for DCF, Net Present Value (NPV), and cash flow evaluations.
- Interactive Dashboard: User-friendly charts and summaries to help you visualize your valuation insights.
- Designed for All Skill Levels: A straightforward layout created for investors, CFOs, and financial consultants alike.
How It Operates
- Download the Template: Get instant access to the Excel-based Tongling Jingda Special Magnet Wire Co., Ltd. DCF Calculator.
- Input Your Assumptions: Modify the yellow-highlighted cells for growth rates, WACC, profit margins, and additional parameters.
- Instant Calculations: The model instantly recalculates the intrinsic value of Tongling Jingda Special Magnet Wire Co., Ltd. (600577SS).
- Test Scenarios: Explore various assumptions to assess how they impact valuation outcomes.
- Analyze and Decide: Leverage the findings to inform your investment strategies or financial assessments.
Why Choose This Calculator for Tongling Jingda Special Magnet Wire Co., Ltd. (600577SS)?
- User-Friendly Interface: Tailored for both novices and experienced users.
- Customizable Inputs: Adjust parameters effortlessly to suit your financial analysis.
- Real-Time Valuation: Witness immediate updates to Tongling Jingda's valuation with any input changes.
- Preloaded Data: Comes equipped with Tongling Jingda’s actual financial figures for swift evaluations.
- Professional Endorsement: Favored by investors and analysts for making well-informed choices.
Who Can Benefit from This Product?
- Finance Students: Acquire skills in valuation methods and practice using real-world data from Tongling Jingda Special Magnet Wire Co., Ltd. (600577SS).
- Academics: Integrate industry-standard models into your courses or research projects involving Tongling Jingda Special Magnet Wire Co., Ltd. (600577SS).
- Investors: Validate your investing strategies and analyze the valuation performance of Tongling Jingda Special Magnet Wire Co., Ltd. (600577SS).
- Analysts: Enhance your workflow with a customizable, ready-to-use DCF model tailored for Tongling Jingda Special Magnet Wire Co., Ltd. (600577SS).
- Small Business Owners: Understand the analytical approaches used for evaluating large public corporations like Tongling Jingda Special Magnet Wire Co., Ltd. (600577SS).
What the Template Contains
- Preloaded 600577SS Data: Historical and projected financial information, including revenue, EBIT, and capital expenditures.
- DCF and WACC Models: Professional-grade templates for calculating intrinsic value and Weighted Average Cost of Capital.
- Editable Inputs: Yellow-highlighted cells for modifying revenue growth, tax rates, and discount rates.
- Financial Statements: Detailed annual and quarterly financials for thorough analysis.
- Key Ratios: Profitability, leverage, and efficiency ratios for assessing performance.
- Dashboard and Charts: Visual representations of valuation results and underlying assumptions.
Disclaimer
All information, articles, and product details provided on this website are for general informational and educational purposes only. We do not claim any ownership over, nor do we intend to infringe upon, any trademarks, copyrights, logos, brand names, or other intellectual property mentioned or depicted on this site. Such intellectual property remains the property of its respective owners, and any references here are made solely for identification or informational purposes, without implying any affiliation, endorsement, or partnership.
We make no representations or warranties, express or implied, regarding the accuracy, completeness, or suitability of any content or products presented. Nothing on this website should be construed as legal, tax, investment, financial, medical, or other professional advice. In addition, no part of this site—including articles or product references—constitutes a solicitation, recommendation, endorsement, advertisement, or offer to buy or sell any securities, franchises, or other financial instruments, particularly in jurisdictions where such activity would be unlawful.
All content is of a general nature and may not address the specific circumstances of any individual or entity. It is not a substitute for professional advice or services. Any actions you take based on the information provided here are strictly at your own risk. You accept full responsibility for any decisions or outcomes arising from your use of this website and agree to release us from any liability in connection with your use of, or reliance upon, the content or products found herein.