
|
Shanghai Highly Co., Ltd. (600619.SS) DCF Valuation |
Fully Editable: Tailor To Your Needs In Excel Or Sheets
Professional Design: Trusted, Industry-Standard Templates
Investor-Approved Valuation Models
MAC/PC Compatible, Fully Unlocked
No Expertise Is Needed; Easy To Follow
Shanghai Highly (Group) Co., Ltd. (600619.SS) Bundle
Enhance your investment strategies with the Shanghai Highly (Group) Co., Ltd. (600619SS) DCF Calculator! Explore genuine financial data, adjust growth predictions and expenses, and instantly observe how these modifications influence the intrinsic value of Shanghai Highly (Group) Co., Ltd. (600619SS).
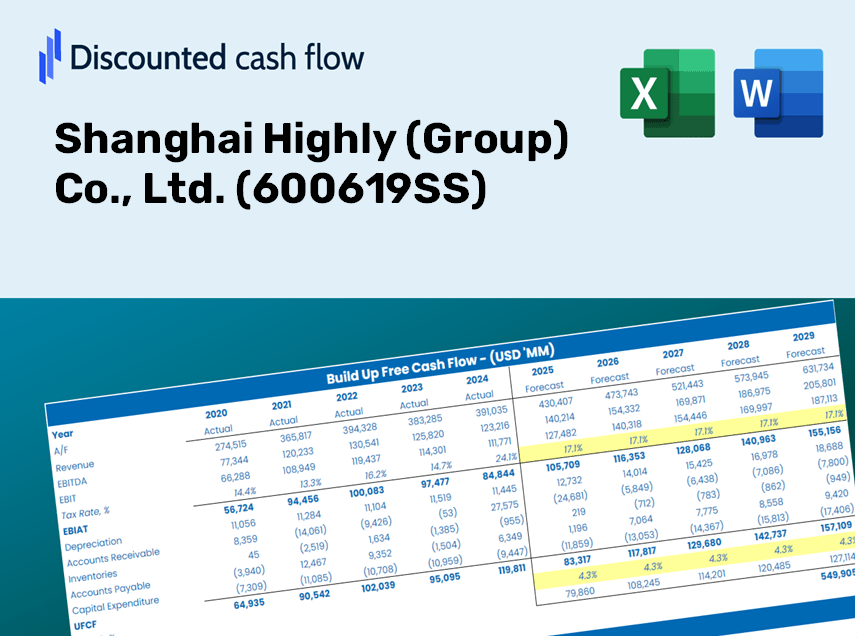
Discounted Cash Flow (DCF) - (USD MM)
| Year | AY1 2020 |
AY2 2021 |
AY3 2022 |
AY4 2023 |
AY5 2024 |
FY1 2025 |
FY2 2026 |
FY3 2027 |
FY4 2028 |
FY5 2029 |
|---|---|---|---|---|---|---|---|---|---|---|
| Revenue | 11,072.5 | 15,768.8 | 16,502.8 | 17,030.7 | 18,747.1 | 21,575.3 | 24,830.3 | 28,576.2 | 32,887.4 | 37,848.9 |
| Revenue Growth, % | 0 | 42.41 | 4.66 | 3.2 | 10.08 | 15.09 | 15.09 | 15.09 | 15.09 | 15.09 |
| EBITDA | 792.9 | 777.0 | 448.9 | 613.1 | 985.8 | 1,021.3 | 1,175.3 | 1,352.7 | 1,556.7 | 1,791.6 |
| EBITDA, % | 7.16 | 4.93 | 2.72 | 3.6 | 5.26 | 4.73 | 4.73 | 4.73 | 4.73 | 4.73 |
| Depreciation | 558.4 | 702.2 | 679.9 | 654.1 | 697.4 | 913.8 | 1,051.6 | 1,210.3 | 1,392.9 | 1,603.0 |
| Depreciation, % | 5.04 | 4.45 | 4.12 | 3.84 | 3.72 | 4.24 | 4.24 | 4.24 | 4.24 | 4.24 |
| EBIT | 234.6 | 74.8 | -231.0 | -40.9 | 288.4 | 107.5 | 123.7 | 142.4 | 163.8 | 188.6 |
| EBIT, % | 2.12 | 0.47438 | -1.4 | -0.24044 | 1.54 | 0.49819 | 0.49819 | 0.49819 | 0.49819 | 0.49819 |
| Total Cash | 2,288.8 | 4,102.3 | 3,618.5 | 3,528.1 | 4,401.2 | 4,867.7 | 5,602.0 | 6,447.1 | 7,419.8 | 8,539.2 |
| Total Cash, percent | .0 | .0 | .0 | .0 | .0 | .0 | .0 | .0 | .0 | .0 |
| Account Receivables | 4,822.0 | 6,519.3 | 6,181.4 | 5,834.0 | 4,450.2 | 7,781.9 | 8,955.9 | 10,307.0 | 11,861.9 | 13,651.5 |
| Account Receivables, % | 43.55 | 41.34 | 37.46 | 34.26 | 23.74 | 36.07 | 36.07 | 36.07 | 36.07 | 36.07 |
| Inventories | 2,042.7 | 2,929.4 | 3,067.4 | 3,744.4 | 5,637.6 | 4,646.1 | 5,347.0 | 6,153.6 | 7,082.0 | 8,150.4 |
| Inventories, % | 18.45 | 18.58 | 18.59 | 21.99 | 30.07 | 21.53 | 21.53 | 21.53 | 21.53 | 21.53 |
| Accounts Payable | 5,176.0 | 6,600.5 | 5,928.8 | 7,684.3 | 9,046.9 | 9,402.9 | 10,821.4 | 12,454.0 | 14,332.9 | 16,495.2 |
| Accounts Payable, % | 46.75 | 41.86 | 35.93 | 45.12 | 48.26 | 43.58 | 43.58 | 43.58 | 43.58 | 43.58 |
| Capital Expenditure | -363.2 | -615.6 | -717.9 | -874.1 | -970.7 | -942.6 | -1,084.8 | -1,248.4 | -1,436.8 | -1,653.6 |
| Capital Expenditure, % | -3.28 | -3.9 | -4.35 | -5.13 | -5.18 | -4.37 | -4.37 | -4.37 | -4.37 | -4.37 |
| Tax Rate, % | 71.42 | 71.42 | 71.42 | 71.42 | 71.42 | 71.42 | 71.42 | 71.42 | 71.42 | 71.42 |
| EBITAT | 186.1 | 100.9 | 101.0 | 13.7 | 82.4 | 44.7 | 51.4 | 59.2 | 68.1 | 78.4 |
| Depreciation | ||||||||||
| Changes in Account Receivables | ||||||||||
| Changes in Inventories | ||||||||||
| Changes in Accounts Payable | ||||||||||
| Capital Expenditure | ||||||||||
| UFCF | -1,307.3 | -972.1 | -408.7 | 1,219.5 | 662.3 | -1,968.3 | -438.1 | -504.2 | -580.2 | -667.8 |
| WACC, % | 13.14 | 13.27 | 12.67 | 12.67 | 12.84 | 12.92 | 12.92 | 12.92 | 12.92 | 12.92 |
| PV UFCF | ||||||||||
| SUM PV UFCF | -3,157.6 | |||||||||
| Long Term Growth Rate, % | 2.00 | |||||||||
| Free cash flow (T + 1) | -681 | |||||||||
| Terminal Value | -6,240 | |||||||||
| Present Terminal Value | -3,399 | |||||||||
| Enterprise Value | -6,557 | |||||||||
| Net Debt | -1,949 | |||||||||
| Equity Value | -4,607 | |||||||||
| Diluted Shares Outstanding, MM | 1,128 | |||||||||
| Equity Value Per Share | -4.08 |
Benefits You Will Receive
- Comprehensive Financial Model: Leveraging Shanghai Highly’s actual data for accurate DCF valuation.
- Complete Forecasting Control: Modify revenue growth, profit margins, WACC, and other essential drivers.
- Real-Time Calculations: Instantaneous updates that display results as adjustments are made.
- Professional-Grade Template: A polished Excel file tailored for high-quality valuation.
- Flexible and Reusable: Designed for adaptability, allowing for repeated use in detailed forecasts.
Key Features
- 🔍 Real-Life SHGC Financials: Pre-filled historical and projected data for Shanghai Highly (Group) Co., Ltd. (600619SS).
- ✏️ Fully Customizable Inputs: Adjust all critical parameters (yellow cells) such as WACC, growth %, and tax rates.
- 📊 Professional DCF Valuation: Integrated formulas calculate the intrinsic value of Shanghai Highly (Group) Co., Ltd. (600619SS) using the Discounted Cash Flow method.
- ⚡ Instant Results: Visualize the valuation of Shanghai Highly (Group) Co., Ltd. (600619SS) instantly after making adjustments.
- Scenario Analysis: Experiment with and compare different outcomes based on various financial assumptions side-by-side.
How It Works
- Download: Obtain the pre-prepared Excel file containing Shanghai Highly (Group) Co., Ltd.'s (600619SS) financial data.
- Customize: Modify projections, including revenue growth, EBITDA percentage, and WACC as needed.
- Update Automatically: Watch as intrinsic value and NPV calculations refresh in real-time.
- Test Scenarios: Generate various projections and compare their outcomes effortlessly.
- Make Decisions: Leverage the valuation results to inform your investment strategies.
Why Opt for Shanghai Highly (Group) Co., Ltd. (600619SS) Calculator?
- Time Efficiency: Skip the hassle of building a DCF model from scratch – it's ready for immediate use.
- Enhanced Precision: Dependable financial data and formulas minimize valuation errors.
- Completely Customizable: Adjust the model to fit your unique assumptions and forecasts.
- User-Friendly: Intuitive charts and outputs facilitate straightforward result analysis.
- Preferred by Professionals: Crafted for experts who prioritize both accuracy and functionality.
Who Should Use This Product?
- Individual Investors: Make informed decisions regarding the purchase or sale of Shanghai Highly (Group) Co., Ltd. (600619SS) stock.
- Financial Analysts: Simplify valuation processes with easily accessible financial models tailored for Shanghai Highly (Group) Co., Ltd. (600619SS).
- Consultants: Provide clients with timely and precise valuation insights related to Shanghai Highly (Group) Co., Ltd. (600619SS).
- Business Owners: Gain a deeper understanding of how large corporations like Shanghai Highly (Group) Co., Ltd. (600619SS) are valued to inform your own business strategies.
- Finance Students: Explore valuation techniques using real-world data and case studies centered around Shanghai Highly (Group) Co., Ltd. (600619SS).
Contents of the Template
- Preloaded 600619SS Data: Historical and projected financial information, including revenue, EBIT, and capital expenditures.
- DCF and WACC Models: Advanced spreadsheets for calculating intrinsic value and Weighted Average Cost of Capital.
- Editable Inputs: Yellow-highlighted cells for modifying revenue growth, tax rates, and discount rates.
- Financial Statements: Detailed annual and quarterly financial reports for thorough analysis.
- Key Ratios: Profitability, leverage, and efficiency ratios to assess performance.
- Dashboard and Charts: Visual representations of valuation results and underlying assumptions.
Disclaimer
All information, articles, and product details provided on this website are for general informational and educational purposes only. We do not claim any ownership over, nor do we intend to infringe upon, any trademarks, copyrights, logos, brand names, or other intellectual property mentioned or depicted on this site. Such intellectual property remains the property of its respective owners, and any references here are made solely for identification or informational purposes, without implying any affiliation, endorsement, or partnership.
We make no representations or warranties, express or implied, regarding the accuracy, completeness, or suitability of any content or products presented. Nothing on this website should be construed as legal, tax, investment, financial, medical, or other professional advice. In addition, no part of this site—including articles or product references—constitutes a solicitation, recommendation, endorsement, advertisement, or offer to buy or sell any securities, franchises, or other financial instruments, particularly in jurisdictions where such activity would be unlawful.
All content is of a general nature and may not address the specific circumstances of any individual or entity. It is not a substitute for professional advice or services. Any actions you take based on the information provided here are strictly at your own risk. You accept full responsibility for any decisions or outcomes arising from your use of this website and agree to release us from any liability in connection with your use of, or reliance upon, the content or products found herein.