
|
Cinda Real Estate Co., Ltd. (600657.SS) DCF Valuation |
Fully Editable: Tailor To Your Needs In Excel Or Sheets
Professional Design: Trusted, Industry-Standard Templates
Investor-Approved Valuation Models
MAC/PC Compatible, Fully Unlocked
No Expertise Is Needed; Easy To Follow
Cinda Real Estate Co., Ltd. (600657.SS) Bundle
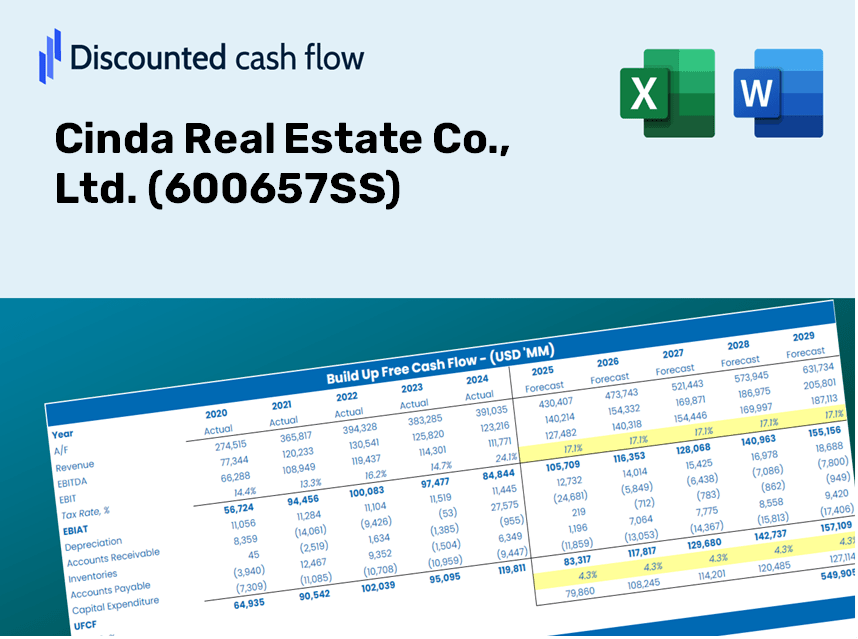
Gain insight into your Cinda Real Estate Co., Ltd. (600657SS) valuation analysis using our sophisticated DCF Calculator! Featuring preloaded real (600657SS) data, this Excel template empowers you to adjust forecasts and assumptions, enabling you to calculate the intrinsic value of Cinda Real Estate Co., Ltd. with accuracy.
Discounted Cash Flow (DCF) - (USD MM)
| Year | AY1 2020 |
AY2 2021 |
AY3 2022 |
AY4 2023 |
AY5 2024 |
FY1 2025 |
FY2 2026 |
FY3 2027 |
FY4 2028 |
FY5 2029 |
|---|---|---|---|---|---|---|---|---|---|---|
| Revenue | 25,863.8 | 22,105.3 | 18,248.1 | 11,420.1 | 8,028.4 | 6,039.4 | 4,543.2 | 3,417.6 | 2,570.9 | 1,934.0 |
| Revenue Growth, % | 0 | -14.53 | -17.45 | -37.42 | -29.7 | -24.77 | -24.77 | -24.77 | -24.77 | -24.77 |
| EBITDA | 3,868.0 | 643.4 | 2,515.2 | 1,420.4 | 923.1 | 671.4 | 505.1 | 379.9 | 285.8 | 215.0 |
| EBITDA, % | 14.96 | 2.91 | 13.78 | 12.44 | 11.5 | 11.12 | 11.12 | 11.12 | 11.12 | 11.12 |
| Depreciation | 28.6 | 30.2 | 25.2 | 36.7 | 23.5 | 12.1 | 9.1 | 6.8 | 5.1 | 3.9 |
| Depreciation, % | 0.11063 | 0.13667 | 0.13791 | 0.32105 | 0.29317 | 0.19989 | 0.19989 | 0.19989 | 0.19989 | 0.19989 |
| EBIT | 3,839.4 | 613.2 | 2,490.0 | 1,383.7 | 899.6 | 659.3 | 496.0 | 373.1 | 280.7 | 211.1 |
| EBIT, % | 14.84 | 2.77 | 13.65 | 12.12 | 11.2 | 10.92 | 10.92 | 10.92 | 10.92 | 10.92 |
| Total Cash | 24,733.0 | 15,145.2 | 14,433.9 | 13,554.7 | 5,734.3 | 5,008.7 | 3,767.8 | 2,834.3 | 2,132.1 | 1,603.9 |
| Total Cash, percent | .0 | .0 | .0 | .0 | .0 | .0 | .0 | .0 | .0 | .0 |
| Account Receivables | 6,305.9 | 991.5 | 4,075.2 | 2,438.6 | 3,997.3 | 1,477.7 | 1,111.6 | 836.2 | 629.1 | 473.2 |
| Account Receivables, % | 24.38 | 4.49 | 22.33 | 21.35 | 49.79 | 24.47 | 24.47 | 24.47 | 24.47 | 24.47 |
| Inventories | 49,106.5 | 44,809.9 | 39,554.3 | 35,723.1 | 34,960.5 | 6,039.4 | 4,543.2 | 3,417.6 | 2,570.9 | 1,934.0 |
| Inventories, % | 189.87 | 202.71 | 216.76 | 312.81 | 435.46 | 100 | 100 | 100 | 100 | 100 |
| Accounts Payable | 4,266.7 | 4,329.5 | 4,210.2 | 3,330.7 | 2,697.1 | 1,472.6 | 1,107.8 | 833.3 | 626.9 | 471.6 |
| Accounts Payable, % | 16.5 | 19.59 | 23.07 | 29.17 | 33.59 | 24.38 | 24.38 | 24.38 | 24.38 | 24.38 |
| Capital Expenditure | -18.7 | -24.2 | -19.7 | -39.6 | -12.7 | -9.6 | -7.2 | -5.4 | -4.1 | -3.1 |
| Capital Expenditure, % | -0.07215065 | -0.10936 | -0.10815 | -0.34665 | -0.15869 | -0.159 | -0.159 | -0.159 | -0.159 | -0.159 |
| Tax Rate, % | -21.99 | -21.99 | -21.99 | -21.99 | -21.99 | -21.99 | -21.99 | -21.99 | -21.99 | -21.99 |
| EBITAT | 1,884.2 | 340.9 | 931.7 | 798.7 | 1,097.4 | 395.3 | 297.4 | 223.7 | 168.3 | 126.6 |
| Depreciation | ||||||||||
| Changes in Account Receivables | ||||||||||
| Changes in Inventories | ||||||||||
| Changes in Accounts Payable | ||||||||||
| Capital Expenditure | ||||||||||
| UFCF | -49,251.4 | 10,020.7 | 2,989.7 | 5,384.1 | -321.6 | 30,613.9 | 1,796.8 | 1,351.6 | 1,016.8 | 764.9 |
| WACC, % | 6.16 | 6.52 | 5.53 | 6.63 | 8.92 | 6.75 | 6.75 | 6.75 | 6.75 | 6.75 |
| PV UFCF | ||||||||||
| SUM PV UFCF | 32,699.5 | |||||||||
| Long Term Growth Rate, % | 2.90 | |||||||||
| Free cash flow (T + 1) | 787 | |||||||||
| Terminal Value | 20,426 | |||||||||
| Present Terminal Value | 14,733 | |||||||||
| Enterprise Value | 47,432 | |||||||||
| Net Debt | 9,801 | |||||||||
| Equity Value | 37,631 | |||||||||
| Diluted Shares Outstanding, MM | 2,903 | |||||||||
| Equity Value Per Share | 12.96 |
Benefits You Will Receive
- Pre-Filled Financial Model: Utilize Cinda Real Estate's actual data for accurate DCF valuation.
- Comprehensive Forecast Control: Modify revenue growth, profit margins, WACC, and other essential metrics.
- Immediate Calculations: Real-time updates allow you to view results as you make adjustments.
- Professional-Grade Template: A polished Excel file crafted for high-quality valuation presentations.
- Customizable and Reusable: Designed for adaptability, enabling repeated application for in-depth forecasts.
Main Features
- Comprehensive Cinda Real Estate Data: Access precise historical information and insightful future forecasts for Cinda Real Estate Co., Ltd. (600657SS).
- Flexible Forecast Parameters: Modify highlighted fields, including WACC, growth rates, and profit margins, to tailor your analysis.
- Real-Time Calculations: Enjoy automatic updates for DCF, Net Present Value (NPV), and cash flow assessments.
- User-Friendly Dashboard: Easily interpret charts and summaries that clarify your valuation findings.
- Suitable for All Skill Levels: Designed with a straightforward layout that caters to investors, CFOs, and consultants alike.
How It Operates
- Download: Obtain the comprehensive Excel file featuring Cinda Real Estate Co., Ltd.'s (600657SS) financial data.
- Customize: Tailor forecasts by modifying key metrics such as revenue growth, EBITDA %, and WACC.
- Update Automatically: Enjoy real-time updates on intrinsic value and NPV calculations.
- Test Scenarios: Generate various projections and instantly compare their outcomes.
- Make Decisions: Leverage the valuation results to inform your investment approach.
Why Choose This Calculator for Cinda Real Estate Co., Ltd. (600657SS)?
- User-Friendly Interface: Tailored for both novices and seasoned analysts.
- Customizable Assumptions: Effortlessly adjust parameters to suit your financial analysis.
- Real-Time Updates: Watch Cinda's valuation fluctuate instantly as you change inputs.
- Preloaded Financials: Comes equipped with Cinda's actual fiscal data for immediate analysis.
- Relied Upon by Experts: Preferred by investors and analysts for making strategic decisions.
Who Can Benefit from Cinda Real Estate Co., Ltd. (600657SS)?
- Investors: Assess Cinda's market valuation prior to making buying or selling decisions.
- CFOs and Financial Analysts: Optimize valuation methods and evaluate financial forecasts.
- Real Estate Developers: Understand the valuation approaches of established firms like Cinda.
- Consultants: Provide comprehensive valuation reports for your clients related to real estate.
- Students and Educators: Utilize current industry data to practice and teach real estate valuation concepts.
Contents of the Template
- Detailed DCF Model: An editable template featuring in-depth valuation calculations.
- Market-Driven Data: Cinda Real Estate Co., Ltd. (600657SS)’s historical and future financials preloaded for examination.
- Adjustable Parameters: Modify WACC, growth rates, and tax assumptions to explore various scenarios.
- Comprehensive Financial Statements: Complete annual and quarterly breakdowns for enhanced analysis.
- Essential Ratios: Integrated analysis for profitability, efficiency, and leverage metrics.
- Visual Dashboard: Charts and tables providing clear, actionable insights.
Disclaimer
All information, articles, and product details provided on this website are for general informational and educational purposes only. We do not claim any ownership over, nor do we intend to infringe upon, any trademarks, copyrights, logos, brand names, or other intellectual property mentioned or depicted on this site. Such intellectual property remains the property of its respective owners, and any references here are made solely for identification or informational purposes, without implying any affiliation, endorsement, or partnership.
We make no representations or warranties, express or implied, regarding the accuracy, completeness, or suitability of any content or products presented. Nothing on this website should be construed as legal, tax, investment, financial, medical, or other professional advice. In addition, no part of this site—including articles or product references—constitutes a solicitation, recommendation, endorsement, advertisement, or offer to buy or sell any securities, franchises, or other financial instruments, particularly in jurisdictions where such activity would be unlawful.
All content is of a general nature and may not address the specific circumstances of any individual or entity. It is not a substitute for professional advice or services. Any actions you take based on the information provided here are strictly at your own risk. You accept full responsibility for any decisions or outcomes arising from your use of this website and agree to release us from any liability in connection with your use of, or reliance upon, the content or products found herein.