
|
Ningbo Fuda Company Limited (600724.SS) DCF Valuation |
Fully Editable: Tailor To Your Needs In Excel Or Sheets
Professional Design: Trusted, Industry-Standard Templates
Investor-Approved Valuation Models
MAC/PC Compatible, Fully Unlocked
No Expertise Is Needed; Easy To Follow
Ningbo Fuda Company Limited (600724.SS) Bundle
Whether you’re an investor or analyst, this (600724SS) DCF Calculator is your go-to resource for accurate valuation. Loaded with real data from Ningbo Fuda Company Limited, you can adjust forecasts and observe the effects in real-time.
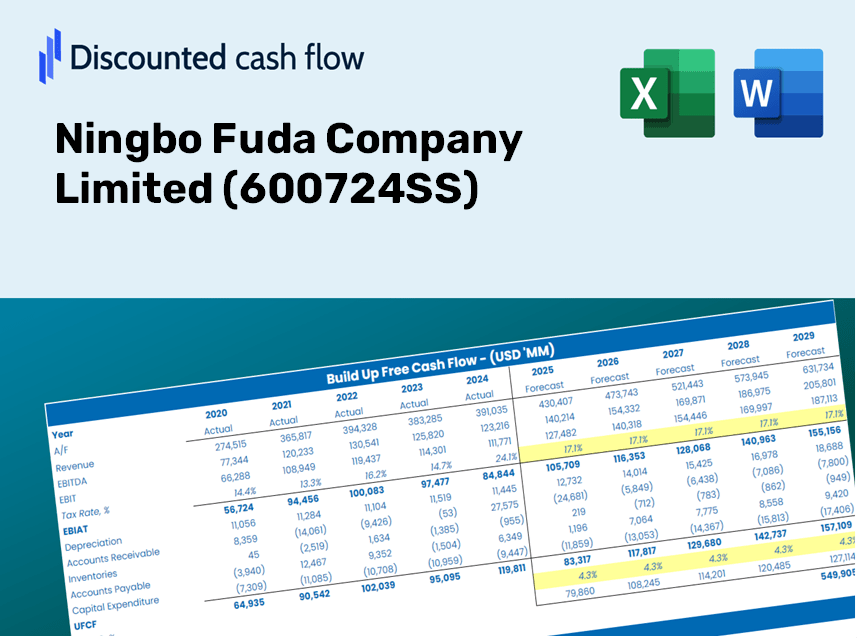
Discounted Cash Flow (DCF) - (USD MM)
| Year | AY1 2020 |
AY2 2021 |
AY3 2022 |
AY4 2023 |
AY5 2024 |
FY1 2025 |
FY2 2026 |
FY3 2027 |
FY4 2028 |
FY5 2029 |
|---|---|---|---|---|---|---|---|---|---|---|
| Revenue | 2,340.3 | 2,340.2 | 3,256.3 | 3,167.3 | 1,700.5 | 1,658.4 | 1,617.4 | 1,577.3 | 1,538.3 | 1,500.2 |
| Revenue Growth, % | 0 | -0.00254198 | 39.14 | -2.73 | -46.31 | -2.48 | -2.48 | -2.48 | -2.48 | -2.48 |
| EBITDA | 699.1 | 611.4 | 446.0 | 372.2 | 358.0 | 340.0 | 331.6 | 323.4 | 315.3 | 307.5 |
| EBITDA, % | 29.87 | 26.13 | 13.69 | 11.75 | 21.05 | 20.5 | 20.5 | 20.5 | 20.5 | 20.5 |
| Depreciation | 129.7 | 128.2 | 130.4 | 146.8 | 139.3 | 92.4 | 90.1 | 87.9 | 85.7 | 83.6 |
| Depreciation, % | 5.54 | 5.48 | 4.01 | 4.63 | 8.19 | 5.57 | 5.57 | 5.57 | 5.57 | 5.57 |
| EBIT | 569.4 | 483.2 | 315.5 | 225.5 | 218.7 | 247.6 | 241.5 | 235.5 | 229.7 | 224.0 |
| EBIT, % | 24.33 | 20.65 | 9.69 | 7.12 | 12.86 | 14.93 | 14.93 | 14.93 | 14.93 | 14.93 |
| Total Cash | 1,542.0 | 1,468.3 | 1,273.1 | 1,600.4 | 785.6 | 877.1 | 855.4 | 834.3 | 813.6 | 793.5 |
| Total Cash, percent | .0 | .0 | .0 | .0 | .0 | .0 | .0 | .0 | .0 | .0 |
| Account Receivables | 474.7 | 475.1 | 490.9 | 494.6 | 336.3 | 302.0 | 294.5 | 287.2 | 280.1 | 273.2 |
| Account Receivables, % | 20.28 | 20.3 | 15.07 | 15.62 | 19.78 | 18.21 | 18.21 | 18.21 | 18.21 | 18.21 |
| Inventories | 152.9 | 190.9 | 216.6 | 303.3 | 102.6 | 122.6 | 119.5 | 116.6 | 113.7 | 110.9 |
| Inventories, % | 6.53 | 8.16 | 6.65 | 9.58 | 6.03 | 7.39 | 7.39 | 7.39 | 7.39 | 7.39 |
| Accounts Payable | 195.8 | 133.5 | 190.6 | 178.9 | 160.0 | 116.0 | 113.2 | 110.4 | 107.6 | 105.0 |
| Accounts Payable, % | 8.37 | 5.7 | 5.85 | 5.65 | 9.41 | 7 | 7 | 7 | 7 | 7 |
| Capital Expenditure | -129.5 | -146.2 | -223.7 | -103.9 | -46.6 | -81.8 | -79.8 | -77.8 | -75.9 | -74.0 |
| Capital Expenditure, % | -5.53 | -6.25 | -6.87 | -3.28 | -2.74 | -4.93 | -4.93 | -4.93 | -4.93 | -4.93 |
| Tax Rate, % | 25.33 | 25.33 | 25.33 | 25.33 | 25.33 | 25.33 | 25.33 | 25.33 | 25.33 | 25.33 |
| EBITAT | 342.7 | 282.5 | 205.8 | 183.0 | 163.3 | 168.2 | 164.1 | 160.0 | 156.0 | 152.2 |
| Depreciation | ||||||||||
| Changes in Account Receivables | ||||||||||
| Changes in Inventories | ||||||||||
| Changes in Accounts Payable | ||||||||||
| Capital Expenditure | ||||||||||
| UFCF | -88.8 | 163.8 | 128.2 | 123.7 | 596.1 | 149.2 | 182.0 | 177.5 | 173.1 | 168.8 |
| WACC, % | 4.86 | 4.86 | 4.87 | 4.91 | 4.9 | 4.88 | 4.88 | 4.88 | 4.88 | 4.88 |
| PV UFCF | ||||||||||
| SUM PV UFCF | 737.6 | |||||||||
| Long Term Growth Rate, % | 2.00 | |||||||||
| Free cash flow (T + 1) | 172 | |||||||||
| Terminal Value | 5,980 | |||||||||
| Present Terminal Value | 4,713 | |||||||||
| Enterprise Value | 5,450 | |||||||||
| Net Debt | -431 | |||||||||
| Equity Value | 5,881 | |||||||||
| Diluted Shares Outstanding, MM | 1,445 | |||||||||
| Equity Value Per Share | 4.07 |
What You Will Receive
- Authentic Ningbo Fuda Financial Data: Included with historical and forecasted data for accurate analysis.
- Completely Customizable Template: Easily adjust key metrics such as revenue growth, WACC, and EBITDA percentage.
- Instant Calculations: Observe real-time updates of Ningbo Fuda’s intrinsic value as you make adjustments.
- Expert Valuation Tool: Crafted for investors, analysts, and consultants looking for reliable DCF outputs.
- Intuitive Design: Streamlined layout and clear guidelines suitable for users of all skill levels.
Key Features
- Customizable Forecast Inputs: Adjust essential variables such as revenue growth, EBITDA margin, and capital expenditure.
- Instant DCF Valuation: Automatically computes intrinsic value, NPV, and additional metrics with ease.
- High-Precision Accuracy: Leverages Ningbo Fuda Company Limited’s actual financial data for dependable valuation results.
- Simplified Scenario Analysis: Effortlessly evaluate various assumptions and analyze differing outcomes.
- Efficiency Booster: Avoid the complexities of constructing valuation models from the ground up.
How It Functions
- Step 1: Download the Excel file for Ningbo Fuda Company Limited (600724SS).
- Step 2: Examine the pre-filled financial information and projections for Ningbo Fuda Company Limited (600724SS).
- Step 3: Adjust key inputs such as revenue growth, WACC, and tax rates (highlighted cells).
- Step 4: Observe the DCF model refresh in real-time as you modify your assumptions.
- Step 5: Evaluate the outputs and leverage the insights for your investment choices.
Why Choose the Ningbo Fuda Calculator?
- Time Efficient: Skip the hassle of building a DCF model from the ground up – it’s ready for immediate use.
- Enhanced Accuracy: Dependable financial data and formulas minimize valuation errors.
- Completely Customizable: Adjust the model to align with your specific assumptions and forecasts.
- User-Friendly Insights: Intuitive charts and results simplify the analysis process.
- Preferred by Professionals: Crafted for industry experts who prioritize precision and ease of use.
Who Can Benefit from This Product?
- Professional Investors: Develop comprehensive and trustworthy valuation models for portfolio assessments related to Ningbo Fuda Company Limited (600724SS).
- Corporate Finance Teams: Evaluate valuation scenarios to inform strategic decisions within the organization.
- Consultants and Advisors: Deliver accurate valuation insights for clients interested in Ningbo Fuda Company Limited (600724SS).
- Students and Educators: Utilize real-world data for practicing and teaching financial modeling techniques related to market valuations.
- Industry Enthusiasts: Gain insights into the valuation processes of companies like Ningbo Fuda Company Limited (600724SS) within the marketplace.
Contents of the Template
- Comprehensive DCF Model: An editable template featuring thorough valuation calculations.
- Real-World Data: Ningbo Fuda Company Limited’s (600724SS) historical and projected financials preloaded for in-depth analysis.
- Customizable Parameters: Modify WACC, growth rates, and tax assumptions to explore various scenarios.
- Financial Statements: Complete annual and quarterly breakdowns for enhanced insights.
- Key Ratios: Integrated analysis covering profitability, efficiency, and leverage metrics.
- Dashboard with Visual Outputs: Engaging charts and tables that present clear, actionable results.
Disclaimer
All information, articles, and product details provided on this website are for general informational and educational purposes only. We do not claim any ownership over, nor do we intend to infringe upon, any trademarks, copyrights, logos, brand names, or other intellectual property mentioned or depicted on this site. Such intellectual property remains the property of its respective owners, and any references here are made solely for identification or informational purposes, without implying any affiliation, endorsement, or partnership.
We make no representations or warranties, express or implied, regarding the accuracy, completeness, or suitability of any content or products presented. Nothing on this website should be construed as legal, tax, investment, financial, medical, or other professional advice. In addition, no part of this site—including articles or product references—constitutes a solicitation, recommendation, endorsement, advertisement, or offer to buy or sell any securities, franchises, or other financial instruments, particularly in jurisdictions where such activity would be unlawful.
All content is of a general nature and may not address the specific circumstances of any individual or entity. It is not a substitute for professional advice or services. Any actions you take based on the information provided here are strictly at your own risk. You accept full responsibility for any decisions or outcomes arising from your use of this website and agree to release us from any liability in connection with your use of, or reliance upon, the content or products found herein.