
|
BAIC BluePark New Energy Technology Co.,Ltd. (600733.SS) DCF Valuation |
Fully Editable: Tailor To Your Needs In Excel Or Sheets
Professional Design: Trusted, Industry-Standard Templates
Investor-Approved Valuation Models
MAC/PC Compatible, Fully Unlocked
No Expertise Is Needed; Easy To Follow
BAIC BluePark New Energy Technology Co.,Ltd. (600733.SS) Bundle
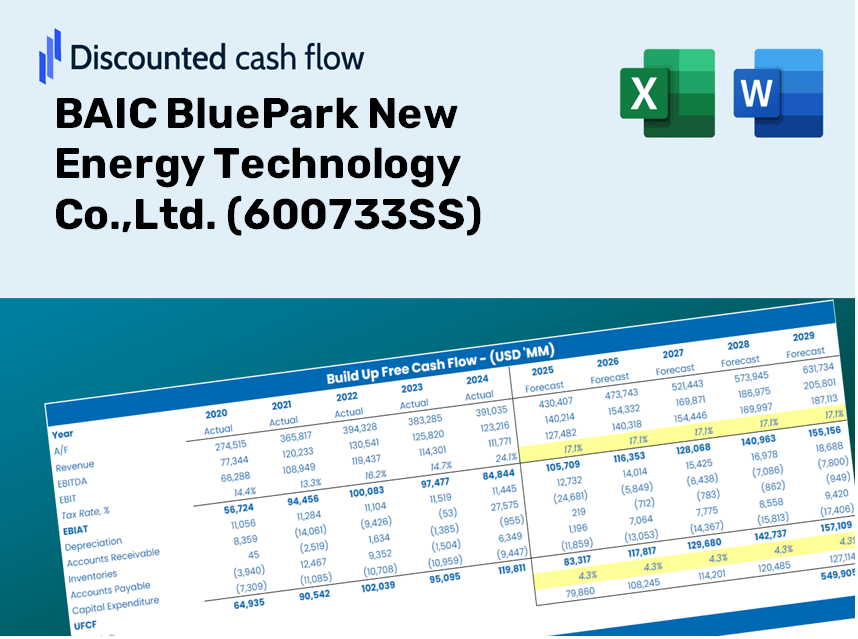
Designed for accuracy, our (600733SS) DCF Calculator enables you to assess BAIC BluePark New Energy Technology Co., Ltd. valuation using real-world financial data and offers complete flexibility to modify all essential parameters for improved projections.
Discounted Cash Flow (DCF) - (USD MM)
| Year | AY1 2020 |
AY2 2021 |
AY3 2022 |
AY4 2023 |
AY5 2024 |
FY1 2025 |
FY2 2026 |
FY3 2027 |
FY4 2028 |
FY5 2029 |
|---|---|---|---|---|---|---|---|---|---|---|
| Revenue | 5,272.5 | 8,696.8 | 9,514.3 | 14,318.6 | 14,511.9 | 19,090.2 | 25,112.8 | 33,035.5 | 43,457.7 | 57,167.8 |
| Revenue Growth, % | 0 | 64.95 | 9.4 | 50.5 | 1.35 | 31.55 | 31.55 | 31.55 | 31.55 | 31.55 |
| EBITDA | -4,249.2 | -1,976.8 | -3,125.5 | -3,875.6 | -4,035.2 | -7,294.2 | -9,595.4 | -12,622.6 | -16,604.8 | -21,843.3 |
| EBITDA, % | -80.59 | -22.73 | -32.85 | -27.07 | -27.81 | -38.21 | -38.21 | -38.21 | -38.21 | -38.21 |
| Depreciation | 1,576.4 | 1,581.7 | 1,595.1 | 1,508.2 | 2,315.1 | 3,487.3 | 4,587.5 | 6,034.8 | 7,938.6 | 10,443.1 |
| Depreciation, % | 29.9 | 18.19 | 16.77 | 10.53 | 15.95 | 18.27 | 18.27 | 18.27 | 18.27 | 18.27 |
| EBIT | -5,825.6 | -3,558.5 | -4,720.6 | -5,383.8 | -6,350.3 | -10,381.0 | -13,656.0 | -17,964.2 | -23,631.6 | -31,087.0 |
| EBIT, % | -110.49 | -40.92 | -49.62 | -37.6 | -43.76 | -54.38 | -54.38 | -54.38 | -54.38 | -54.38 |
| Total Cash | 3,969.7 | 6,627.3 | 4,900.9 | 5,844.8 | 11,851.8 | 12,427.5 | 16,348.2 | 21,505.8 | 28,290.5 | 37,215.6 |
| Total Cash, percent | .0 | .0 | .0 | .0 | .0 | .0 | .0 | .0 | .0 | .0 |
| Account Receivables | 19,859.9 | 16,900.7 | 9,085.0 | 7,264.1 | 9,843.5 | 15,808.6 | 20,795.9 | 27,356.7 | 35,987.3 | 47,340.7 |
| Account Receivables, % | 376.67 | 194.33 | 95.49 | 50.73 | 67.83 | 82.81 | 82.81 | 82.81 | 82.81 | 82.81 |
| Inventories | 4,082.6 | 1,244.4 | 3,109.6 | 1,657.1 | 1,689.9 | 5,637.0 | 7,415.4 | 9,754.9 | 12,832.4 | 16,880.8 |
| Inventories, % | 77.43 | 14.31 | 32.68 | 11.57 | 11.64 | 29.53 | 29.53 | 29.53 | 29.53 | 29.53 |
| Accounts Payable | 7,316.9 | 6,320.2 | 8,451.7 | 6,620.9 | 15,677.1 | 15,567.8 | 20,479.2 | 26,940.1 | 35,439.3 | 46,619.8 |
| Accounts Payable, % | 138.78 | 72.67 | 88.83 | 46.24 | 108.03 | 81.55 | 81.55 | 81.55 | 81.55 | 81.55 |
| Capital Expenditure | -1,072.9 | -2,262.0 | -2,060.9 | -2,245.7 | -2,555.7 | -3,868.2 | -5,088.5 | -6,693.9 | -8,805.7 | -11,583.7 |
| Capital Expenditure, % | -20.35 | -26.01 | -21.66 | -15.68 | -17.61 | -20.26 | -20.26 | -20.26 | -20.26 | -20.26 |
| Tax Rate, % | -2.2 | -2.2 | -2.2 | -2.2 | -2.2 | -2.2 | -2.2 | -2.2 | -2.2 | -2.2 |
| EBITAT | -5,755.4 | -3,602.4 | -4,755.7 | -5,435.1 | -6,489.9 | -10,356.0 | -13,623.1 | -17,921.0 | -23,574.7 | -31,012.2 |
| Depreciation | ||||||||||
| Changes in Account Receivables | ||||||||||
| Changes in Inventories | ||||||||||
| Changes in Accounts Payable | ||||||||||
| Capital Expenditure | ||||||||||
| UFCF | -21,877.5 | 518.0 | 2,860.6 | -4,730.0 | -286.3 | -20,758.4 | -15,978.5 | -21,019.5 | -27,650.8 | -36,374.1 |
| WACC, % | 7.8 | 7.81 | 7.81 | 7.81 | 7.81 | 7.81 | 7.81 | 7.81 | 7.81 | 7.81 |
| PV UFCF | ||||||||||
| SUM PV UFCF | -95,217.2 | |||||||||
| Long Term Growth Rate, % | 2.00 | |||||||||
| Free cash flow (T + 1) | -37,102 | |||||||||
| Terminal Value | -638,526 | |||||||||
| Present Terminal Value | -438,403 | |||||||||
| Enterprise Value | -533,620 | |||||||||
| Net Debt | -3,365 | |||||||||
| Equity Value | -530,255 | |||||||||
| Diluted Shares Outstanding, MM | 5,574 | |||||||||
| Equity Value Per Share | -95.14 |
Benefits You'll Receive
- Authentic BAIC BluePark Financial Data: Pre-populated with historical and projected financial information for in-depth analysis.
- Completely Customizable Template: Effortlessly adjust key metrics such as revenue growth, WACC, and EBITDA percentage.
- Instant Calculations: Watch as the intrinsic value of BAIC BluePark updates in real-time with your adjustments.
- Expert Valuation Tool: Tailored for investors, analysts, and consultants who require precise DCF evaluations.
- Intuitive User Interface: A straightforward layout with clear guidance suitable for users of all experience levels.
Key Features
- Customizable Forecast Inputs: Adjust essential parameters such as growth rate, operational margins, and investment plans.
- Instant DCF Valuation: Automatically computes intrinsic value, net present value (NPV), and additional financial metrics.
- High-Precision Results: Leverages BAIC BluePark's actual financial data for accurate valuation outputs.
- Effortless Scenario Analysis: Easily evaluate varying assumptions and analyze different outcomes.
- Efficiency-Boosting Solution: Streamlines the valuation process, removing the need for intricate model development from the ground up.
How It Functions
- Download the Template: Obtain immediate access to the Excel-based BAIC BluePark DCF Calculator.
- Input Your Assumptions: Modify the yellow-highlighted cells for growth rates, WACC, profit margins, and additional parameters.
- Real-Time Calculations: The model will automatically refresh to display BAIC BluePark's intrinsic value.
- Explore Scenarios: Experiment with various assumptions to assess potential valuation fluctuations.
- Analyze and Conclude: Leverage the findings to inform your investment or financial assessments.
Why Choose BAIC BluePark's Calculator?
- Time-Saving: Skip the hassle of building a DCF model from the ground up – it's ready for your use.
- Enhanced Accuracy: Dependable financial data and formulas minimize valuation errors.
- Fully Customizable: Adjust the model to align with your forecasts and assumptions.
- User-Friendly: Intuitive charts and outputs simplify data interpretation.
- Preferred by Professionals: Crafted for experts who prioritize both precision and functionality.
Who Can Benefit from BAIC BluePark New Energy Technology Co., Ltd.?
- Students of Renewable Energy: Understand sustainable technologies and apply them using real-world data.
- Researchers: Integrate industry models into academic studies or projects.
- Investors: Evaluate your investment strategies and assess valuation scenarios for BAIC BluePark New Energy (600733SS).
- Market Analysts: Enhance your analysis with a customizable, ready-to-use financial model.
- Entrepreneurs in Clean Tech: Discover how major energy firms are appraised in the market.
Contents of the Template
- Preloaded BAIC BluePark Data: Historical and forecasted financial metrics, including revenue, EBIT, and capital expenditures.
- DCF and WACC Models: Advanced sheets designed for calculating intrinsic value and the Weighted Average Cost of Capital.
- Editable Inputs: Yellow-highlighted fields for customizing revenue growth, tax rates, and discount rates.
- Financial Statements: Detailed annual and quarterly financial reports for in-depth analysis.
- Key Ratios: Ratios analyzing profitability, leverage, and efficiency to assess performance.
- Dashboard and Charts: Visual representations of valuation results and underlying assumptions.
Disclaimer
All information, articles, and product details provided on this website are for general informational and educational purposes only. We do not claim any ownership over, nor do we intend to infringe upon, any trademarks, copyrights, logos, brand names, or other intellectual property mentioned or depicted on this site. Such intellectual property remains the property of its respective owners, and any references here are made solely for identification or informational purposes, without implying any affiliation, endorsement, or partnership.
We make no representations or warranties, express or implied, regarding the accuracy, completeness, or suitability of any content or products presented. Nothing on this website should be construed as legal, tax, investment, financial, medical, or other professional advice. In addition, no part of this site—including articles or product references—constitutes a solicitation, recommendation, endorsement, advertisement, or offer to buy or sell any securities, franchises, or other financial instruments, particularly in jurisdictions where such activity would be unlawful.
All content is of a general nature and may not address the specific circumstances of any individual or entity. It is not a substitute for professional advice or services. Any actions you take based on the information provided here are strictly at your own risk. You accept full responsibility for any decisions or outcomes arising from your use of this website and agree to release us from any liability in connection with your use of, or reliance upon, the content or products found herein.