
|
Shandong Xinchao Energy Corporation Limited (600777.SS) DCF Valuation |
Fully Editable: Tailor To Your Needs In Excel Or Sheets
Professional Design: Trusted, Industry-Standard Templates
Investor-Approved Valuation Models
MAC/PC Compatible, Fully Unlocked
No Expertise Is Needed; Easy To Follow
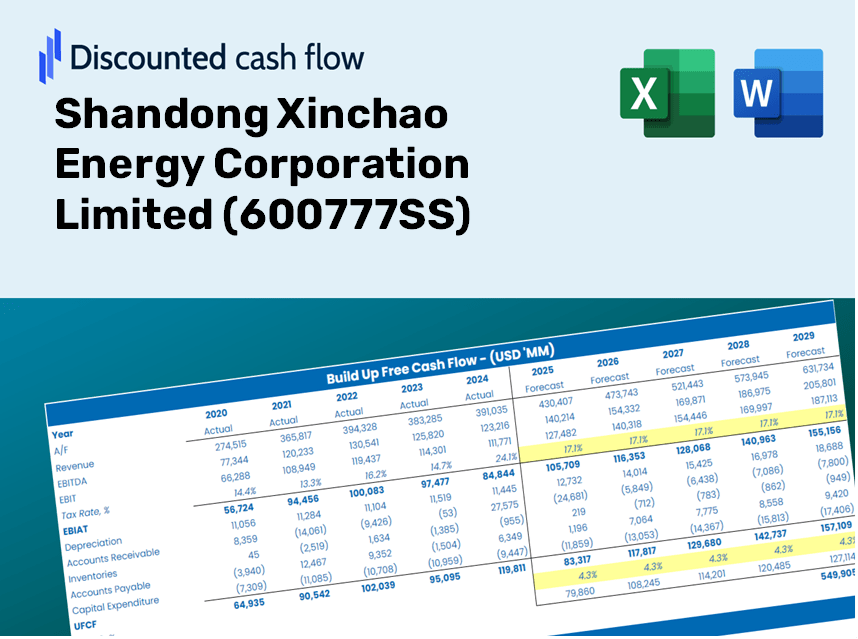
Shandong Xinchao Energy Corporation Limited (600777.SS) Bundle
Enhance your investment strategy with the (600777SS) DCF Calculator! Review authentic Shandong Xinchao Energy Corporation Limited financials, adjust growth predictions and expenses, and instantly observe how these alterations affect the intrinsic value of (600777SS).
Discounted Cash Flow (DCF) - (USD MM)
| Year | AY1 2020 |
AY2 2021 |
AY3 2022 |
AY4 2023 |
AY5 2024 |
FY1 2025 |
FY2 2026 |
FY3 2027 |
FY4 2028 |
FY5 2029 |
|---|---|---|---|---|---|---|---|---|---|---|
| Revenue | 3,987.3 | 4,541.1 | 8,837.0 | 8,433.6 | 7,969.9 | 9,931.0 | 12,374.7 | 15,419.7 | 19,214.0 | 23,941.9 |
| Revenue Growth, % | 0 | 13.89 | 94.6 | -4.56 | -5.5 | 24.61 | 24.61 | 24.61 | 24.61 | 24.61 |
| EBITDA | 2,727.3 | 3,593.3 | 7,483.1 | 6,744.8 | 6,290.7 | 7,768.3 | 9,679.8 | 12,061.7 | 15,029.7 | 18,728.0 |
| EBITDA, % | 68.4 | 79.13 | 84.68 | 79.97 | 78.93 | 78.22 | 78.22 | 78.22 | 78.22 | 78.22 |
| Depreciation | 5,328.8 | 1,952.6 | 2,415.6 | 3,095.0 | 3,325.9 | 4,940.9 | 6,156.7 | 7,671.7 | 9,559.4 | 11,911.7 |
| Depreciation, % | 133.64 | 43 | 27.33 | 36.7 | 41.73 | 49.75 | 49.75 | 49.75 | 49.75 | 49.75 |
| EBIT | -2,601.5 | 1,640.7 | 5,067.6 | 3,649.7 | 2,964.8 | 2,159.2 | 2,690.5 | 3,352.5 | 4,177.4 | 5,205.3 |
| EBIT, % | -65.24 | 36.13 | 57.34 | 43.28 | 37.2 | 21.74 | 21.74 | 21.74 | 21.74 | 21.74 |
| Total Cash | 842.2 | 806.2 | 1,481.6 | 2,405.1 | 3,657.3 | 2,583.0 | 3,218.6 | 4,010.6 | 4,997.5 | 6,227.2 |
| Total Cash, percent | .0 | .0 | .0 | .0 | .0 | .0 | .0 | .0 | .0 | .0 |
| Account Receivables | 948.3 | 1,416.9 | 1,617.5 | 1,334.3 | 1,216.9 | 2,073.2 | 2,583.3 | 3,219.0 | 4,011.1 | 4,998.1 |
| Account Receivables, % | 23.78 | 31.2 | 18.3 | 15.82 | 15.27 | 20.88 | 20.88 | 20.88 | 20.88 | 20.88 |
| Inventories | 144.7 | 178.1 | 133.4 | 137.2 | 52.2 | 225.3 | 280.7 | 349.8 | 435.9 | 543.2 |
| Inventories, % | 3.63 | 3.92 | 1.51 | 1.63 | 0.65519 | 2.27 | 2.27 | 2.27 | 2.27 | 2.27 |
| Accounts Payable | 594.4 | 479.0 | 1,137.0 | 468.0 | 733.2 | 1,054.1 | 1,313.5 | 1,636.7 | 2,039.5 | 2,541.3 |
| Accounts Payable, % | 14.91 | 10.55 | 12.87 | 5.55 | 9.2 | 10.61 | 10.61 | 10.61 | 10.61 | 10.61 |
| Capital Expenditure | -1,850.8 | -4,896.6 | -3,654.7 | -4,575.9 | -3,409.5 | -5,656.9 | -7,048.9 | -8,783.4 | -10,944.7 | -13,637.8 |
| Capital Expenditure, % | -46.42 | -107.83 | -41.36 | -54.26 | -42.78 | -56.96 | -56.96 | -56.96 | -56.96 | -56.96 |
| Tax Rate, % | 21.77 | 21.77 | 21.77 | 21.77 | 21.77 | 21.77 | 21.77 | 21.77 | 21.77 | 21.77 |
| EBITAT | -2,191.3 | 998.8 | 3,856.9 | 2,872.7 | 2,319.3 | 1,633.0 | 2,034.8 | 2,535.5 | 3,159.5 | 3,936.9 |
| Depreciation | ||||||||||
| Changes in Account Receivables | ||||||||||
| Changes in Inventories | ||||||||||
| Changes in Accounts Payable | ||||||||||
| Capital Expenditure | ||||||||||
| UFCF | 788.1 | -2,562.6 | 3,119.9 | 1,002.2 | 2,703.4 | 208.6 | 836.5 | 1,042.3 | 1,298.8 | 1,618.3 |
| WACC, % | 6.16 | 5.82 | 6.04 | 6.08 | 6.07 | 6.04 | 6.04 | 6.04 | 6.04 | 6.04 |
| PV UFCF | ||||||||||
| SUM PV UFCF | 4,049.5 | |||||||||
| Long Term Growth Rate, % | 0.50 | |||||||||
| Free cash flow (T + 1) | 1,626 | |||||||||
| Terminal Value | 29,380 | |||||||||
| Present Terminal Value | 21,918 | |||||||||
| Enterprise Value | 25,967 | |||||||||
| Net Debt | 3,878 | |||||||||
| Equity Value | 22,089 | |||||||||
| Diluted Shares Outstanding, MM | 6,801 | |||||||||
| Equity Value Per Share | 3.25 |
Benefits of Choosing Us
- Comprehensive Financial Data for Shandong Xinchao (600777SS): Access both historical and projected financials for precise valuation.
- Customizable Parameters: Adjust inputs like WACC, tax rates, revenue growth, and capital expenditures.
- Dynamic Calculations: Intrinsic value and NPV are automatically computed in real-time.
- Scenario Analysis Capabilities: Explore various scenarios to assess the future performance of Shandong Xinchao.
- User-Friendly Interface: Designed for professionals while remaining easy to navigate for newcomers.
Key Features
- Authentic Historical Data: Comes pre-loaded with Shandong Xinchao Energy Corporation Limited's (600777SS) historical financial metrics and future forecasts.
- Customizable Variables: Tailor revenue growth rates, profit margins, WACC, tax percentages, and capital expenditures to fit your analysis needs.
- Interactive Valuation Framework: Automatically refreshes Net Present Value (NPV) and intrinsic value in response to your customized inputs.
- Comprehensive Scenario Analysis: Develop and evaluate multiple forecasting scenarios to explore various valuation results.
- Intuitive Interface: User-friendly layout designed for both industry professionals and newcomers.
How It Works
- Step 1: Download the Excel file.
- Step 2: Review the pre-filled data for Shandong Xinchao Energy Corporation Limited (600777SS), including both historical and forecasted figures.
- Step 3: Modify the key assumptions (highlighted in yellow) according to your analysis.
- Step 4: Observe the automatic recalculations reflecting the intrinsic value of Shandong Xinchao Energy Corporation Limited (600777SS).
- Step 5: Utilize the results for your investment strategies or reporting needs.
Why Opt for This Calculator?
- Comprehensive Analysis: Integrates DCF, WACC, and financial ratio evaluations all in one tool.
- Flexible Inputs: Modify the yellow-highlighted cells to explore various scenarios.
- In-Depth Insights: Automatically computes the intrinsic value and Net Present Value for Shandong Xinchao Energy Corporation Limited (600777SS).
- Preloaded Information: Comes with historical and projected data for reliable starting metrics.
- Professional Grade: Perfectly suited for financial analysts, investors, and business advisors.
Who Should Use This Product?
- Finance Students: Master valuation techniques and apply them with real data relevant to Shandong Xinchao Energy Corporation Limited (600777SS).
- Academics: Integrate industry-standard models into your coursework or research focused on Shandong Xinchao Energy Corporation Limited (600777SS).
- Investors: Validate your assumptions and analyze valuation results for Shandong Xinchao Energy Corporation Limited (600777SS).
- Analysts: Enhance your efficiency with a customizable DCF model tailored for Shandong Xinchao Energy Corporation Limited (600777SS).
- Small Business Owners: Discover how valuation methods used for large public entities like Shandong Xinchao Energy Corporation Limited (600777SS) can benefit your own analysis.
What the Template Includes
- Pre-Populated Data: Contains Shandong Xinchao Energy Corporation Limited’s historical financials and projections.
- Discounted Cash Flow Model: An editable DCF valuation model featuring automatic calculations.
- Weighted Average Cost of Capital (WACC): A dedicated sheet for computing WACC based on user-defined inputs.
- Key Financial Ratios: Assess the profitability, efficiency, and leverage of Shandong Xinchao Energy Corporation Limited.
- Customizable Inputs: Easily modify revenue growth rates, margins, and tax rates.
- User-Friendly Dashboard: Visual charts and tables that summarize essential valuation results.
Disclaimer
All information, articles, and product details provided on this website are for general informational and educational purposes only. We do not claim any ownership over, nor do we intend to infringe upon, any trademarks, copyrights, logos, brand names, or other intellectual property mentioned or depicted on this site. Such intellectual property remains the property of its respective owners, and any references here are made solely for identification or informational purposes, without implying any affiliation, endorsement, or partnership.
We make no representations or warranties, express or implied, regarding the accuracy, completeness, or suitability of any content or products presented. Nothing on this website should be construed as legal, tax, investment, financial, medical, or other professional advice. In addition, no part of this site—including articles or product references—constitutes a solicitation, recommendation, endorsement, advertisement, or offer to buy or sell any securities, franchises, or other financial instruments, particularly in jurisdictions where such activity would be unlawful.
All content is of a general nature and may not address the specific circumstances of any individual or entity. It is not a substitute for professional advice or services. Any actions you take based on the information provided here are strictly at your own risk. You accept full responsibility for any decisions or outcomes arising from your use of this website and agree to release us from any liability in connection with your use of, or reliance upon, the content or products found herein.