
|
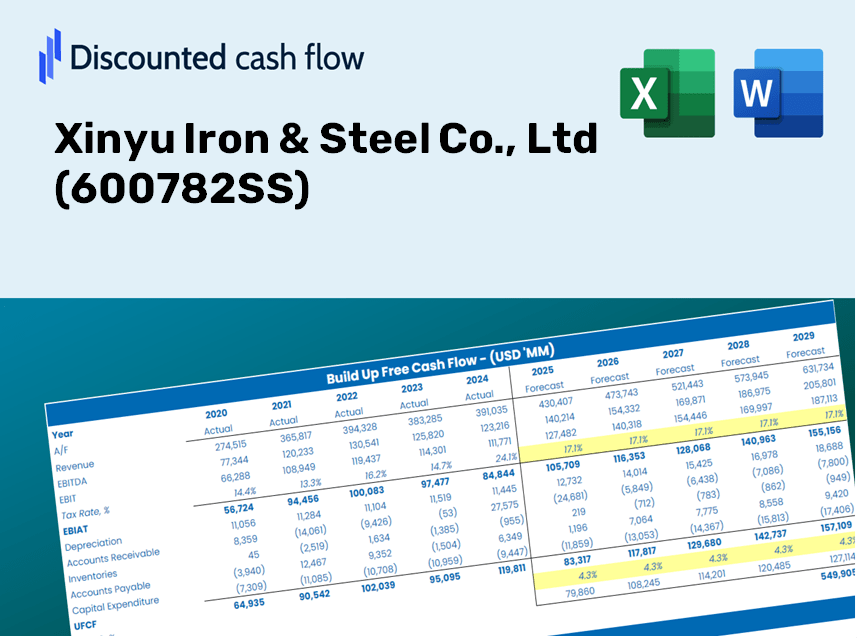
Xinyu Iron & Steel Co., Ltd (600782.SS) DCF Valuation |
Fully Editable: Tailor To Your Needs In Excel Or Sheets
Professional Design: Trusted, Industry-Standard Templates
Investor-Approved Valuation Models
MAC/PC Compatible, Fully Unlocked
No Expertise Is Needed; Easy To Follow
Xinyu Iron & Steel Co., Ltd (600782.SS) Bundle
Enhance your investment strategies with the (600782SS) DCF Calculator! Utilize accurate financial data for Xinyu Iron & Steel Co., Ltd, adjust growth projections and expenses, and instantly observe how these changes affect the intrinsic value of [Company].
Discounted Cash Flow (DCF) - (USD MM)
| Year | AY1 2020 |
AY2 2021 |
AY3 2022 |
AY4 2023 |
AY5 2024 |
FY1 2025 |
FY2 2026 |
FY3 2027 |
FY4 2028 |
FY5 2029 |
|---|---|---|---|---|---|---|---|---|---|---|
| Revenue | 72,411.9 | 104,912.8 | 99,001.3 | 71,143.0 | 41,803.6 | 43,158.3 | 44,556.8 | 46,000.7 | 47,491.4 | 49,030.4 |
| Revenue Growth, % | 0 | 44.88 | -5.63 | -28.14 | -41.24 | 3.24 | 3.24 | 3.24 | 3.24 | 3.24 |
| EBITDA | 4,005.3 | 6,594.1 | 2,562.0 | 1,794.3 | 1,297.4 | 1,728.9 | 1,785.0 | 1,842.8 | 1,902.5 | 1,964.2 |
| EBITDA, % | 5.53 | 6.29 | 2.59 | 2.52 | 3.1 | 4.01 | 4.01 | 4.01 | 4.01 | 4.01 |
| Depreciation | 1,014.0 | 1,063.1 | 1,152.4 | 1,103.8 | 1,107.4 | 671.4 | 693.1 | 715.6 | 738.8 | 762.7 |
| Depreciation, % | 1.4 | 1.01 | 1.16 | 1.55 | 2.65 | 1.56 | 1.56 | 1.56 | 1.56 | 1.56 |
| EBIT | 2,991.3 | 5,531.1 | 1,409.6 | 690.5 | 190.0 | 1,057.5 | 1,091.8 | 1,127.2 | 1,163.7 | 1,201.4 |
| EBIT, % | 4.13 | 5.27 | 1.42 | 0.97063 | 0.45458 | 2.45 | 2.45 | 2.45 | 2.45 | 2.45 |
| Total Cash | 5,617.4 | 6,453.7 | 4,690.6 | 9,053.1 | 11,486.1 | 5,079.6 | 5,244.2 | 5,414.2 | 5,589.6 | 5,770.7 |
| Total Cash, percent | .0 | .0 | .0 | .0 | .0 | .0 | .0 | .0 | .0 | .0 |
| Account Receivables | 9,387.4 | 10,199.4 | 7,710.8 | 8,289.0 | 4,533.5 | 4,572.2 | 4,720.4 | 4,873.3 | 5,031.3 | 5,194.3 |
| Account Receivables, % | 12.96 | 9.72 | 7.79 | 11.65 | 10.84 | 10.59 | 10.59 | 10.59 | 10.59 | 10.59 |
| Inventories | 6,071.6 | 6,248.6 | 6,005.4 | 4,839.4 | 4,416.2 | 3,260.5 | 3,366.1 | 3,475.2 | 3,587.8 | 3,704.1 |
| Inventories, % | 8.38 | 5.96 | 6.07 | 6.8 | 10.56 | 7.55 | 7.55 | 7.55 | 7.55 | 7.55 |
| Accounts Payable | 16,408.7 | 18,753.6 | 15,549.6 | 15,109.6 | 16,746.0 | 10,145.6 | 10,474.4 | 10,813.8 | 11,164.2 | 11,526.0 |
| Accounts Payable, % | 22.66 | 17.88 | 15.71 | 21.24 | 40.06 | 23.51 | 23.51 | 23.51 | 23.51 | 23.51 |
| Capital Expenditure | -964.3 | -1,255.8 | -1,164.0 | -2,324.2 | -692.6 | -744.8 | -768.9 | -793.8 | -819.5 | -846.1 |
| Capital Expenditure, % | -1.33 | -1.2 | -1.18 | -3.27 | -1.66 | -1.73 | -1.73 | -1.73 | -1.73 | -1.73 |
| Tax Rate, % | 18.58 | 18.58 | 18.58 | 18.58 | 18.58 | 18.58 | 18.58 | 18.58 | 18.58 | 18.58 |
| EBITAT | 2,455.4 | 4,608.2 | 1,216.8 | 614.8 | 154.7 | 892.9 | 921.9 | 951.7 | 982.6 | 1,014.4 |
| Depreciation | ||||||||||
| Changes in Account Receivables | ||||||||||
| Changes in Inventories | ||||||||||
| Changes in Accounts Payable | ||||||||||
| Capital Expenditure | ||||||||||
| UFCF | 3,454.7 | 5,771.4 | 733.0 | -457.8 | 6,384.6 | -4,663.8 | 921.1 | 950.9 | 981.7 | 1,013.5 |
| WACC, % | 4.75 | 4.77 | 4.8 | 4.82 | 4.75 | 4.78 | 4.78 | 4.78 | 4.78 | 4.78 |
| PV UFCF | ||||||||||
| SUM PV UFCF | -1,168.4 | |||||||||
| Long Term Growth Rate, % | 2.00 | |||||||||
| Free cash flow (T + 1) | 1,034 | |||||||||
| Terminal Value | 37,222 | |||||||||
| Present Terminal Value | 29,476 | |||||||||
| Enterprise Value | 28,307 | |||||||||
| Net Debt | 209 | |||||||||
| Equity Value | 28,098 | |||||||||
| Diluted Shares Outstanding, MM | 3,146 | |||||||||
| Equity Value Per Share | 8.93 |
What You'll Receive
- Authentic Xinyu Iron & Steel Financial Data: Pre-loaded with historical and forecasted data for accurate analysis.
- Completely Customizable Template: Easily adjust essential inputs such as revenue growth, WACC, and EBITDA %.
- Real-Time Calculations: Track instant updates to Xinyu Iron & Steel's intrinsic value based on your modifications.
- Expert Valuation Tool: Tailored for investors, analysts, and consultants aiming for precise DCF outcomes.
- Intuitive Design: Streamlined layout and straightforward instructions suitable for all user experience levels.
Key Features
- Genuine Financial Insights: Gain access to precise historical data and future forecasts for Xinyu Iron & Steel Co., Ltd (600782SS).
- Tailorable Forecast Parameters: Modify the highlighted yellow cells, including WACC, growth rates, and profit margins.
- Automated Calculations: Enjoy automatic updates for DCF, Net Present Value (NPV), and cash flow assessments.
- Interactive Dashboard: Utilize user-friendly charts and summaries to effectively visualize your valuation outcomes.
- Designed for All Levels: A straightforward and intuitive framework suitable for investors, CFOs, and consultants alike.
How It Works
- 1. Access the Template: Download and open the Excel file containing Xinyu Iron & Steel Co., Ltd's (600782SS) preloaded financial data.
- 2. Modify Assumptions: Update key inputs such as growth projections, weighted average cost of capital (WACC), and capital expenditures.
- 3. View Results Immediately: The discounted cash flow (DCF) model automatically computes intrinsic value and net present value (NPV).
- 4. Evaluate Scenarios: Analyze different valuation outcomes by comparing various forecasts.
- 5. Present with Assurance: Deliver professional valuation insights to back your decisions.
Why Opt for This Calculator?
- Precision: Utilizes genuine Xinyu Iron & Steel Co., Ltd (600782SS) financial data to guarantee reliability.
- Versatility: Tailored for users to experiment with and adjust inputs as needed.
- Efficiency: Bypass the complexity of constructing a financial model from the ground up.
- High-Quality Standards: Crafted with the accuracy and usability expected by industry professionals.
- Intuitive Design: Simple to navigate, making it accessible for those without extensive financial modeling skills.
Who Can Benefit from This Product?
- Institutional Investors: Develop comprehensive and trustworthy valuation models for assessing portfolios related to Xinyu Iron & Steel Co., Ltd (600782SS).
- Corporate Finance Departments: Evaluate valuation scenarios to inform strategic decisions within the organization.
- Financial Consultants and Advisors: Offer clients precise valuation analyses for shares of Xinyu Iron & Steel Co., Ltd (600782SS).
- Students and Instructors: Utilize current data for learning and practicing financial modeling techniques.
- Industry Analysts: Gain insights into how companies in the iron and steel sector, like Xinyu Iron & Steel Co., Ltd (600782SS), are valued in the market.
Contents of the Template
- Preloaded XINYU Data: Historical and projected financial information, including revenue, EBIT, and capital expenditures.
- DCF and WACC Models: Advanced spreadsheets for determining intrinsic value and Weighted Average Cost of Capital.
- Editable Inputs: Yellow-highlighted fields for modifying revenue growth, tax rates, and discount rates.
- Financial Statements: Detailed annual and quarterly financials for in-depth analysis.
- Key Ratios: Metrics on profitability, leverage, and efficiency to assess performance.
- Dashboard and Charts: Visual representations of valuation results and underlying assumptions.
Disclaimer
All information, articles, and product details provided on this website are for general informational and educational purposes only. We do not claim any ownership over, nor do we intend to infringe upon, any trademarks, copyrights, logos, brand names, or other intellectual property mentioned or depicted on this site. Such intellectual property remains the property of its respective owners, and any references here are made solely for identification or informational purposes, without implying any affiliation, endorsement, or partnership.
We make no representations or warranties, express or implied, regarding the accuracy, completeness, or suitability of any content or products presented. Nothing on this website should be construed as legal, tax, investment, financial, medical, or other professional advice. In addition, no part of this site—including articles or product references—constitutes a solicitation, recommendation, endorsement, advertisement, or offer to buy or sell any securities, franchises, or other financial instruments, particularly in jurisdictions where such activity would be unlawful.
All content is of a general nature and may not address the specific circumstances of any individual or entity. It is not a substitute for professional advice or services. Any actions you take based on the information provided here are strictly at your own risk. You accept full responsibility for any decisions or outcomes arising from your use of this website and agree to release us from any liability in connection with your use of, or reliance upon, the content or products found herein.