
|
Luxin Venture Capital Group Co., Ltd. (600783.SS) DCF Valuation |
Fully Editable: Tailor To Your Needs In Excel Or Sheets
Professional Design: Trusted, Industry-Standard Templates
Investor-Approved Valuation Models
MAC/PC Compatible, Fully Unlocked
No Expertise Is Needed; Easy To Follow
Luxin Venture Capital Group Co., Ltd. (600783.SS) Bundle
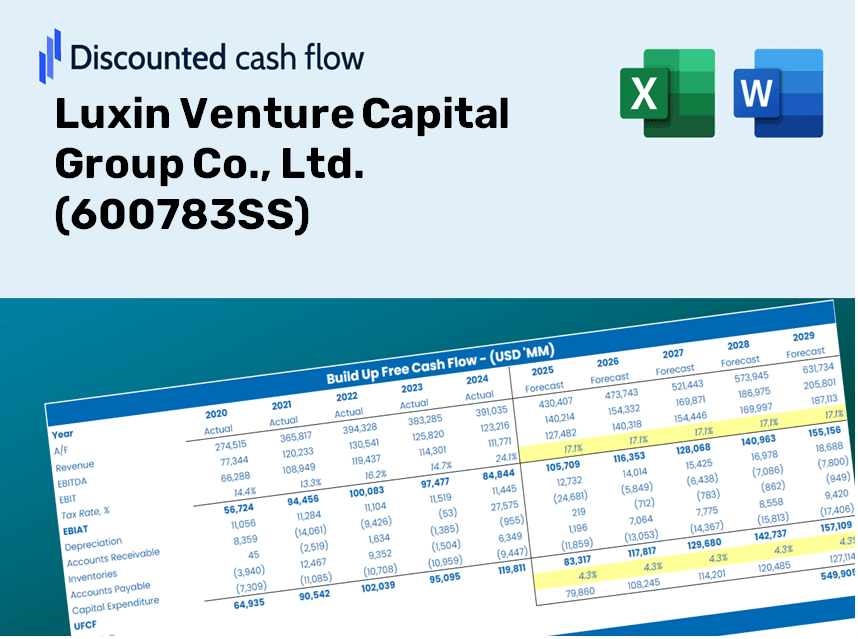
Simplify Luxin Venture Capital Group Co., Ltd. (600783SS) valuation with this customizable DCF Calculator! Featuring real Luxin Venture Capital Group Co., Ltd. (600783SS) financials and adjustable forecast inputs, you can test scenarios and uncover Luxin Venture Capital Group Co., Ltd. (600783SS) fair value in minutes.
Discounted Cash Flow (DCF) - (USD MM)
| Year | AY1 2020 |
AY2 2021 |
AY3 2022 |
AY4 2023 |
AY5 2024 |
FY1 2025 |
FY2 2026 |
FY3 2027 |
FY4 2028 |
FY5 2029 |
|---|---|---|---|---|---|---|---|---|---|---|
| Revenue | 120.8 | 135.1 | 115.6 | 80.3 | 84.0 | 78.0 | 72.4 | 67.2 | 62.4 | 57.9 |
| Revenue Growth, % | 0 | 11.78 | -14.39 | -30.57 | 4.57 | -7.15 | -7.15 | -7.15 | -7.15 | -7.15 |
| EBITDA | -72.8 | -69.3 | -106.0 | -87.2 | -73.4 | -60.9 | -56.6 | -52.5 | -48.8 | -45.3 |
| EBITDA, % | -60.25 | -51.31 | -91.65 | -108.65 | -87.46 | -78.13 | -78.13 | -78.13 | -78.13 | -78.13 |
| Depreciation | 7.7 | 7.9 | 8.7 | 10.8 | 11.0 | 7.2 | 6.7 | 6.2 | 5.8 | 5.4 |
| Depreciation, % | 6.36 | 5.82 | 7.5 | 13.42 | 13.13 | 9.25 | 9.25 | 9.25 | 9.25 | 9.25 |
| EBIT | -80.5 | -77.2 | -114.6 | -98.0 | -84.5 | -65.9 | -61.2 | -56.8 | -52.8 | -49.0 |
| EBIT, % | -66.61 | -57.13 | -99.15 | -122.07 | -100.59 | -84.58 | -84.58 | -84.58 | -84.58 | -84.58 |
| Total Cash | 1,473.7 | 1,320.2 | 2,033.3 | 1,488.1 | 1,346.7 | 78.0 | 72.4 | 67.2 | 62.4 | 57.9 |
| Total Cash, percent | .0 | .0 | .0 | .0 | .0 | .0 | .0 | .0 | .0 | .0 |
| Account Receivables | 41.7 | 29.4 | 27.0 | 35.8 | 41.5 | 27.1 | 25.1 | 23.3 | 21.7 | 20.1 |
| Account Receivables, % | 34.51 | 21.79 | 23.34 | 44.59 | 49.43 | 34.73 | 34.73 | 34.73 | 34.73 | 34.73 |
| Inventories | 28.6 | 35.7 | 14.8 | 14.1 | 16.2 | 15.5 | 14.4 | 13.4 | 12.4 | 11.5 |
| Inventories, % | 23.64 | 26.4 | 12.79 | 17.57 | 19.25 | 19.93 | 19.93 | 19.93 | 19.93 | 19.93 |
| Accounts Payable | 14.0 | 13.9 | 10.7 | 5.9 | 5.7 | 7.1 | 6.5 | 6.1 | 5.6 | 5.2 |
| Accounts Payable, % | 11.58 | 10.28 | 9.25 | 7.38 | 6.73 | 9.05 | 9.05 | 9.05 | 9.05 | 9.05 |
| Capital Expenditure | -2.1 | -3.9 | -192.3 | -3.6 | -7.7 | -18.4 | -17.1 | -15.9 | -14.8 | -13.7 |
| Capital Expenditure, % | -1.72 | -2.92 | -166.26 | -4.46 | -9.16 | -23.65 | -23.65 | -23.65 | -23.65 | -23.65 |
| Tax Rate, % | 25.67 | 25.67 | 25.67 | 25.67 | 25.67 | 25.67 | 25.67 | 25.67 | 25.67 | 25.67 |
| EBITAT | -58.4 | -63.3 | -91.6 | -72.8 | -62.8 | -50.5 | -46.9 | -43.6 | -40.4 | -37.5 |
| Depreciation | ||||||||||
| Changes in Account Receivables | ||||||||||
| Changes in Inventories | ||||||||||
| Changes in Accounts Payable | ||||||||||
| Capital Expenditure | ||||||||||
| UFCF | -109.1 | -54.3 | -255.1 | -78.5 | -67.5 | -45.3 | -54.8 | -50.9 | -47.2 | -43.9 |
| WACC, % | 7.03 | 7.14 | 7.11 | 7.05 | 7.05 | 7.08 | 7.08 | 7.08 | 7.08 | 7.08 |
| PV UFCF | ||||||||||
| SUM PV UFCF | -198.6 | |||||||||
| Long Term Growth Rate, % | 4.00 | |||||||||
| Free cash flow (T + 1) | -46 | |||||||||
| Terminal Value | -1,483 | |||||||||
| Present Terminal Value | -1,054 | |||||||||
| Enterprise Value | -1,252 | |||||||||
| Net Debt | 3,094 | |||||||||
| Equity Value | -4,346 | |||||||||
| Diluted Shares Outstanding, MM | 736 | |||||||||
| Equity Value Per Share | -5.90 |
What You Will Gain
- Authentic 600783SS Financials: Access to historical data and forecasts for precise valuations.
- Customizable Inputs: Adjust key variables such as WACC, tax rates, revenue growth, and capital expenditures.
- Real-Time Calculations: Dynamic computation of intrinsic value and NPV.
- Scenario Evaluation: Analyze various scenarios to assess Luxin Venture Capital Group's future potential.
- User-Friendly Design: Crafted for industry professionals while remaining approachable for newcomers.
Key Features
- Customizable Investment Parameters: Adjust essential metrics such as projected returns, risk levels, and investment horizons.
- Instantaneous DCF Valuation: Quickly computes intrinsic value, NPV, and various financial projections.
- Precision at a Professional Level: Leverages Luxin Venture Capital Group’s real financial data for accurate investment assessments.
- Streamlined Scenario Analysis: Effortlessly explore different investment scenarios and evaluate their potential impacts.
- Efficiency Booster: Avoid the complexities of creating detailed investment models from the ground up.
How It Operates
- Download: Obtain the pre-configured Excel file containing financial data for Luxin Venture Capital Group Co., Ltd. (600783SS).
- Customize: Modify projections such as revenue growth, EBITDA percentage, and cost of capital.
- Update Automatically: The intrinsic value and NPV calculations refresh in real-time.
- Test Scenarios: Develop various forecasts and swiftly compare the results.
- Make Decisions: Leverage the valuation insights to inform your investment approach.
Why Choose Luxin Venture Capital Group Co., Ltd. (600783SS) Calculator?
- Time-Saving: Skip the hassle of building a DCF model from the ground up – it’s ready for immediate use.
- Increased Precision: Dependable financial data and calculations minimize valuation errors.
- Completely Customizable: Adjust the model to align with your unique assumptions and forecasts.
- User-Friendly: Intuitive charts and outputs simplify result interpretation and analysis.
- Endorsed by Professionals: Crafted for experts who prioritize accuracy and functionality.
Who Can Benefit from Our Services?
- Finance Students: Acquire essential valuation skills and practice with real market data.
- Researchers: Utilize industry-standard models in academic projects or studies.
- Investors: Validate your strategies and assess valuation metrics for Luxin Venture Capital Group Co., Ltd. (600783SS).
- Financial Analysts: Enhance your analysis process with our customizable DCF model.
- Entrepreneurs: Discover how major public firms like Luxin Venture Capital Group Co., Ltd. (600783SS) conduct their valuation assessments.
Contents of the Template
- Pre-Filled DCF Model: Luxin Venture Capital Group Co., Ltd.'s (600783SS) financial data ready for immediate application.
- WACC Calculator: Comprehensive calculations for the Weighted Average Cost of Capital.
- Financial Ratios: Assess Luxin's profitability, leverage, and operational efficiency.
- Editable Inputs: Customize assumptions like growth rates, profit margins, and capital expenditures to match your scenarios.
- Financial Statements: Access annual and quarterly reports for thorough analysis.
- Interactive Dashboard: Effortlessly visualize key valuation metrics and outcomes.
Disclaimer
All information, articles, and product details provided on this website are for general informational and educational purposes only. We do not claim any ownership over, nor do we intend to infringe upon, any trademarks, copyrights, logos, brand names, or other intellectual property mentioned or depicted on this site. Such intellectual property remains the property of its respective owners, and any references here are made solely for identification or informational purposes, without implying any affiliation, endorsement, or partnership.
We make no representations or warranties, express or implied, regarding the accuracy, completeness, or suitability of any content or products presented. Nothing on this website should be construed as legal, tax, investment, financial, medical, or other professional advice. In addition, no part of this site—including articles or product references—constitutes a solicitation, recommendation, endorsement, advertisement, or offer to buy or sell any securities, franchises, or other financial instruments, particularly in jurisdictions where such activity would be unlawful.
All content is of a general nature and may not address the specific circumstances of any individual or entity. It is not a substitute for professional advice or services. Any actions you take based on the information provided here are strictly at your own risk. You accept full responsibility for any decisions or outcomes arising from your use of this website and agree to release us from any liability in connection with your use of, or reliance upon, the content or products found herein.