
|
North China Pharmaceutical Company Ltd. (600812.SS) DCF Valuation |
Fully Editable: Tailor To Your Needs In Excel Or Sheets
Professional Design: Trusted, Industry-Standard Templates
Investor-Approved Valuation Models
MAC/PC Compatible, Fully Unlocked
No Expertise Is Needed; Easy To Follow
North China Pharmaceutical Company Ltd. (600812.SS) Bundle
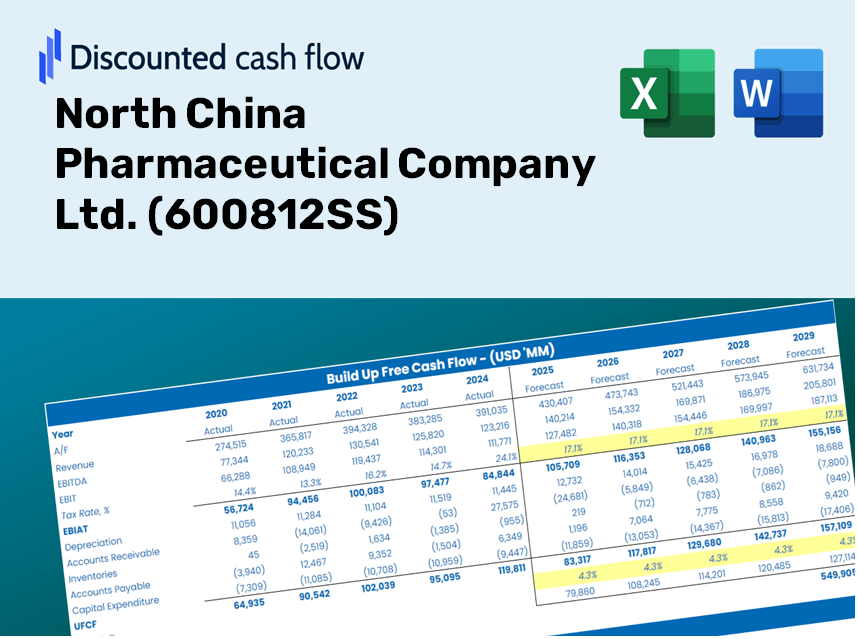
Gain insights into your North China Pharmaceutical Company Ltd. (600812SS) valuation analysis with our state-of-the-art DCF Calculator! Equipped with real-time (600812SS) data, this Excel template enables you to adjust forecasts and assumptions to accurately determine the intrinsic value of North China Pharmaceutical Company Ltd.
Discounted Cash Flow (DCF) - (USD MM)
| Year | AY1 2020 |
AY2 2021 |
AY3 2022 |
AY4 2023 |
AY5 2024 |
FY1 2025 |
FY2 2026 |
FY3 2027 |
FY4 2028 |
FY5 2029 |
|---|---|---|---|---|---|---|---|---|---|---|
| Revenue | 11,492.5 | 10,384.6 | 10,499.9 | 10,120.2 | 9,869.6 | 9,508.8 | 9,161.2 | 8,826.3 | 8,503.6 | 8,192.8 |
| Revenue Growth, % | 0 | -9.64 | 1.11 | -3.62 | -2.48 | -3.66 | -3.66 | -3.66 | -3.66 | -3.66 |
| EBITDA | 1,218.0 | 1,224.1 | 1,346.8 | 1,275.5 | 1,461.5 | 1,190.9 | 1,147.4 | 1,105.5 | 1,065.0 | 1,026.1 |
| EBITDA, % | 10.6 | 11.79 | 12.83 | 12.6 | 14.81 | 12.52 | 12.52 | 12.52 | 12.52 | 12.52 |
| Depreciation | 620.1 | 624.0 | 712.0 | 739.0 | 788.5 | 636.7 | 613.4 | 591.0 | 569.4 | 548.5 |
| Depreciation, % | 5.4 | 6.01 | 6.78 | 7.3 | 7.99 | 6.7 | 6.7 | 6.7 | 6.7 | 6.7 |
| EBIT | 597.9 | 600.1 | 634.8 | 536.4 | 672.9 | 554.3 | 534.0 | 514.5 | 495.7 | 477.6 |
| EBIT, % | 5.2 | 5.78 | 6.05 | 5.3 | 6.82 | 5.83 | 5.83 | 5.83 | 5.83 | 5.83 |
| Total Cash | 4,907.5 | 5,305.0 | 1,682.7 | 988.3 | 1,660.3 | 2,594.0 | 2,499.2 | 2,407.8 | 2,319.8 | 2,235.0 |
| Total Cash, percent | .0 | .0 | .0 | .0 | .0 | .0 | .0 | .0 | .0 | .0 |
| Account Receivables | 1,831.3 | 4,590.6 | 4,334.6 | 2,066.3 | 3,728.2 | 3,035.5 | 2,924.5 | 2,817.6 | 2,714.6 | 2,615.4 |
| Account Receivables, % | 15.93 | 44.21 | 41.28 | 20.42 | 37.77 | 31.92 | 31.92 | 31.92 | 31.92 | 31.92 |
| Inventories | 2,452.9 | 2,391.9 | 2,523.3 | 2,607.8 | 2,510.5 | 2,274.8 | 2,191.6 | 2,111.5 | 2,034.3 | 1,959.9 |
| Inventories, % | 21.34 | 23.03 | 24.03 | 25.77 | 25.44 | 23.92 | 23.92 | 23.92 | 23.92 | 23.92 |
| Accounts Payable | 2,600.5 | 2,891.1 | 2,782.6 | 2,489.9 | 2,295.1 | 2,373.9 | 2,287.1 | 2,203.5 | 2,123.0 | 2,045.4 |
| Accounts Payable, % | 22.63 | 27.84 | 26.5 | 24.6 | 23.25 | 24.97 | 24.97 | 24.97 | 24.97 | 24.97 |
| Capital Expenditure | -1,006.8 | -547.5 | -549.6 | -623.0 | -784.2 | -634.6 | -611.4 | -589.1 | -567.5 | -546.8 |
| Capital Expenditure, % | -8.76 | -5.27 | -5.23 | -6.16 | -7.95 | -6.67 | -6.67 | -6.67 | -6.67 | -6.67 |
| Tax Rate, % | 59.01 | 59.01 | 59.01 | 59.01 | 59.01 | 59.01 | 59.01 | 59.01 | 59.01 | 59.01 |
| EBITAT | 311.7 | 83.3 | 774.3 | 16.5 | 275.8 | 232.9 | 224.4 | 216.2 | 208.3 | 200.7 |
| Depreciation | ||||||||||
| Changes in Account Receivables | ||||||||||
| Changes in Inventories | ||||||||||
| Changes in Accounts Payable | ||||||||||
| Capital Expenditure | ||||||||||
| UFCF | -1,758.8 | -2,247.8 | 952.8 | 2,023.6 | -1,479.4 | 1,242.3 | 333.7 | 321.5 | 309.8 | 298.4 |
| WACC, % | 3.84 | 2.99 | 4.91 | 2.75 | 3.6 | 3.62 | 3.62 | 3.62 | 3.62 | 3.62 |
| PV UFCF | ||||||||||
| SUM PV UFCF | 2,317.2 | |||||||||
| Long Term Growth Rate, % | 2.00 | |||||||||
| Free cash flow (T + 1) | 304 | |||||||||
| Terminal Value | 18,805 | |||||||||
| Present Terminal Value | 15,742 | |||||||||
| Enterprise Value | 18,060 | |||||||||
| Net Debt | 9,157 | |||||||||
| Equity Value | 8,902 | |||||||||
| Diluted Shares Outstanding, MM | 1,716 | |||||||||
| Equity Value Per Share | 5.19 |
What You Will Receive
- Editable Forecast Inputs: Effortlessly adjust assumptions (growth %, margins, WACC) to explore different scenarios.
- Real-World Data: North China Pharmaceutical Company Ltd. (600812SS) financial data pre-populated to kickstart your analysis.
- Automatic DCF Outputs: The model computes Net Present Value (NPV) and intrinsic value seamlessly for you.
- Customizable and Professional: A refined Excel template that tailors to your valuation requirements.
- Designed for Analysts and Investors: Perfect for assessing projections, validating strategies, and enhancing efficiency.
Key Features
- Pre-Loaded Data: North China Pharmaceutical Company Ltd.'s historical financial statements and pre-filled forecasts.
- Fully Adjustable Inputs: Customize WACC, tax rates, revenue growth, and EBITDA margins.
- Instant Results: Watch North China Pharmaceutical Company Ltd.'s intrinsic value recalculate in real time.
- Clear Visual Outputs: Dashboard charts illustrate valuation results and key metrics.
- Built for Accuracy: A professional tool tailored for analysts, investors, and finance professionals.
How It Works
- 1. Access the Template: Download and open the Excel file containing North China Pharmaceutical Company Ltd.’s (600812SS) preloaded data.
- 2. Modify Assumptions: Adjust essential inputs such as growth rates, WACC, and capital expenditures.
- 3. View Results Instantly: The DCF model automatically calculates intrinsic value and NPV in real-time.
- 4. Explore Scenarios: Evaluate multiple forecasts to investigate various valuation possibilities.
- 5. Present with Assurance: Deliver professional valuation insights to substantiate your decisions.
Why Select This Calculator for North China Pharmaceutical Company Ltd. (600812SS)?
- All-in-One Solution: Features DCF, WACC, and financial ratio analyses consolidated in a single tool.
- Flexible Input Options: Modify the yellow-highlighted fields to explore different financial scenarios.
- In-Depth Analysis: Automatically computes the intrinsic value and Net Present Value for North China Pharmaceutical Company Ltd. (600812SS).
- Preloaded Information: Includes both historical and projected data for accurate initial assessments.
- High-Caliber Quality: Perfect for financial analysts, investors, and business consultants focusing on North China Pharmaceutical Company Ltd. (600812SS).
Who Should Use This Product?
- Individual Investors: Make informed decisions about buying or selling North China Pharmaceutical Company Ltd. (600812SS).
- Financial Analysts: Enhance valuation processes with ready-to-use financial models specific to North China Pharmaceutical Company Ltd. (600812SS).
- Consultants: Provide clients with professional valuation insights regarding North China Pharmaceutical Company Ltd. (600812SS) quickly and accurately.
- Business Owners: Gain a better understanding of how companies like North China Pharmaceutical Company Ltd. (600812SS) are valued to inform your own business strategy.
- Finance Students: Explore valuation techniques using real-world data and scenarios related to North China Pharmaceutical Company Ltd. (600812SS).
Contents of the Template
- Pre-Filled Data: Contains historical financials and future projections for North China Pharmaceutical Company Ltd. (600812SS).
- Discounted Cash Flow Model: An editable DCF valuation model featuring automatic calculations.
- Weighted Average Cost of Capital (WACC): A dedicated worksheet for calculating WACC using your custom inputs.
- Key Financial Ratios: Assess North China Pharmaceutical's profitability, efficiency, and leverage metrics.
- Customizable Inputs: Easily modify revenue growth, profit margins, and tax rates.
- Clear Dashboard: Visual representations including charts and tables summarizing essential valuation outcomes.
Disclaimer
All information, articles, and product details provided on this website are for general informational and educational purposes only. We do not claim any ownership over, nor do we intend to infringe upon, any trademarks, copyrights, logos, brand names, or other intellectual property mentioned or depicted on this site. Such intellectual property remains the property of its respective owners, and any references here are made solely for identification or informational purposes, without implying any affiliation, endorsement, or partnership.
We make no representations or warranties, express or implied, regarding the accuracy, completeness, or suitability of any content or products presented. Nothing on this website should be construed as legal, tax, investment, financial, medical, or other professional advice. In addition, no part of this site—including articles or product references—constitutes a solicitation, recommendation, endorsement, advertisement, or offer to buy or sell any securities, franchises, or other financial instruments, particularly in jurisdictions where such activity would be unlawful.
All content is of a general nature and may not address the specific circumstances of any individual or entity. It is not a substitute for professional advice or services. Any actions you take based on the information provided here are strictly at your own risk. You accept full responsibility for any decisions or outcomes arising from your use of this website and agree to release us from any liability in connection with your use of, or reliance upon, the content or products found herein.