
|
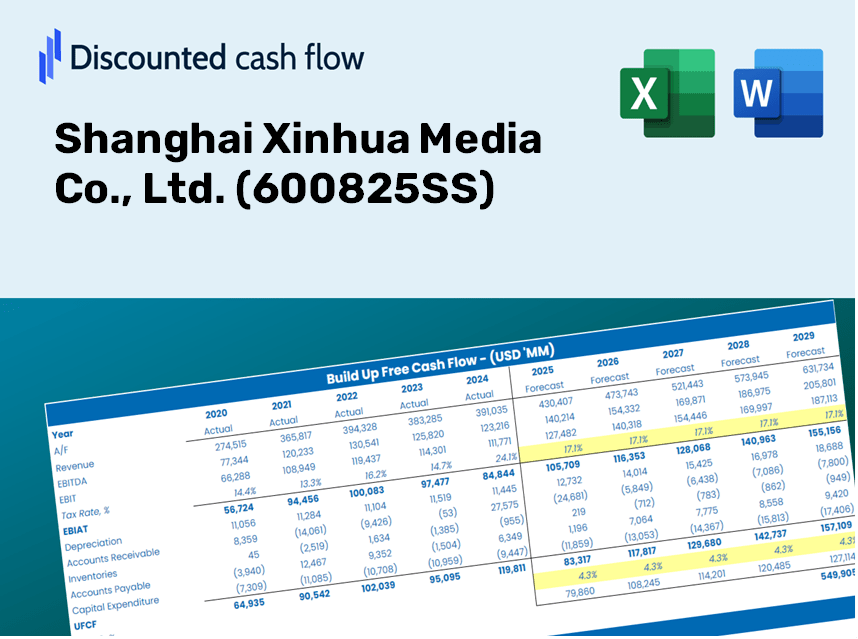
Shanghai Xinhua Media Co., Ltd. (600825.SS) DCF Valuation |
Fully Editable: Tailor To Your Needs In Excel Or Sheets
Professional Design: Trusted, Industry-Standard Templates
Investor-Approved Valuation Models
MAC/PC Compatible, Fully Unlocked
No Expertise Is Needed; Easy To Follow
Shanghai Xinhua Media Co., Ltd. (600825.SS) Bundle
Evaluate Shanghai Xinhua Media Co., Ltd.'s financial outlook like an expert! This (600825SS) DCF Calculator provides you with pre-filled financial data and full flexibility to modify revenue growth, WACC, margins, and other essential assumptions to align with your projections.
Benefits You Will Receive
- Customizable Excel Template: An adaptable Excel-based DCF Calculator featuring pre-filled financial data for Shanghai Xinhua Media Co., Ltd. (600825SS).
- Accurate Market Data: Access to historical data and forward-looking projections (highlighted in the yellow cells).
- Flexible Forecasting: Adjust key assumptions such as revenue growth, EBITDA margin, and WACC.
- Instant Calculations: View the immediate effects of your inputs on the valuation of Shanghai Xinhua Media Co., Ltd. (600825SS).
- Professional Resource: Designed for investors, CFOs, consultants, and financial analysts.
- User-Friendly Interface: Organized for ease of understanding, complete with step-by-step guidance.
Key Features
- Pre-Loaded Data: Historical financial statements and pre-filled forecasts for Shanghai Xinhua Media Co., Ltd. (600825SS).
- Fully Adjustable Inputs: Customize WACC, tax rates, revenue growth, and EBITDA margins to fit your analysis.
- Instant Results: View the intrinsic value of Shanghai Xinhua Media Co., Ltd. (600825SS) update in real time.
- Clear Visual Outputs: Intuitive dashboard charts present valuation results and essential metrics.
- Built for Accuracy: A specialized tool designed for analysts, investors, and finance professionals.
How It Works
- Step 1: Download the Excel spreadsheet.
- Step 2: Examine the pre-loaded data for Shanghai Xinhua Media Co., Ltd. (600825SS) including historical and forecasted figures.
- Step 3: Modify the key assumptions (highlighted in yellow) based on your insights.
- Step 4: Observe the automatic recalculations of Shanghai Xinhua Media Co., Ltd.'s (600825SS) intrinsic value.
- Step 5: Utilize the results for your investment strategies or reporting purposes.
Why Choose This Calculator for Shanghai Xinhua Media Co., Ltd. (600825SS)?
- Reliable Data: Leverage authentic financial information from Shanghai Xinhua Media for trustworthy valuation outcomes.
- Flexible Options: Modify essential variables such as growth rates, WACC, and tax rates to align with your forecasts.
- Efficiency Boost: Built-in calculations save you time and eliminate the hassle of starting from scratch.
- Professional Quality: Tailored for investors, analysts, and consultants in the media industry.
- Easy to Use: A user-friendly design along with clear, step-by-step guidance makes it accessible for everyone.
Who Can Benefit From Shanghai Xinhua Media Co., Ltd. (600825SS)?
- Investors: Leverage a top-tier valuation tool to make informed investment decisions.
- Financial Analysts: Enhance efficiency with a ready-to-use DCF model that can be tailored to specific needs.
- Consultants: Easily modify the template for impactful presentations or comprehensive reports for clients.
- Finance Enthusiasts: Expand your knowledge of valuation methods with practical, real-world case studies.
- Educators and Students: Utilize this resource as an effective teaching aid in finance-related disciplines.
What the Template Includes
- Pre-Filled DCF Model: Shanghai Xinhua Media Co., Ltd.'s (600825SS) financial data preloaded for immediate utilization.
- WACC Calculator: Comprehensive calculations for Weighted Average Cost of Capital.
- Financial Ratios: Assess Shanghai Xinhua Media Co., Ltd.'s profitability, leverage, and efficiency metrics.
- Editable Inputs: Adjust assumptions such as growth rates, margins, and capital expenditures to tailor your scenarios.
- Financial Statements: Access annual and quarterly reports to facilitate in-depth analysis.
- Interactive Dashboard: Effortlessly visualize essential valuation metrics and outcomes.
Disclaimer
All information, articles, and product details provided on this website are for general informational and educational purposes only. We do not claim any ownership over, nor do we intend to infringe upon, any trademarks, copyrights, logos, brand names, or other intellectual property mentioned or depicted on this site. Such intellectual property remains the property of its respective owners, and any references here are made solely for identification or informational purposes, without implying any affiliation, endorsement, or partnership.
We make no representations or warranties, express or implied, regarding the accuracy, completeness, or suitability of any content or products presented. Nothing on this website should be construed as legal, tax, investment, financial, medical, or other professional advice. In addition, no part of this site—including articles or product references—constitutes a solicitation, recommendation, endorsement, advertisement, or offer to buy or sell any securities, franchises, or other financial instruments, particularly in jurisdictions where such activity would be unlawful.
All content is of a general nature and may not address the specific circumstances of any individual or entity. It is not a substitute for professional advice or services. Any actions you take based on the information provided here are strictly at your own risk. You accept full responsibility for any decisions or outcomes arising from your use of this website and agree to release us from any liability in connection with your use of, or reliance upon, the content or products found herein.