
|
Shang Gong Group Co., Ltd. (600843.SS) DCF Valuation |
Fully Editable: Tailor To Your Needs In Excel Or Sheets
Professional Design: Trusted, Industry-Standard Templates
Investor-Approved Valuation Models
MAC/PC Compatible, Fully Unlocked
No Expertise Is Needed; Easy To Follow
Shang Gong Group Co., Ltd. (600843.SS) Bundle
As an investor or analyst, the Shang Gong Group Co., Ltd. (600843SS) DCF Calculator is your go-to resource for accurate valuation. With real data from Shang Gong Group preloaded, you can easily adjust forecasts and instantly observe the effects.
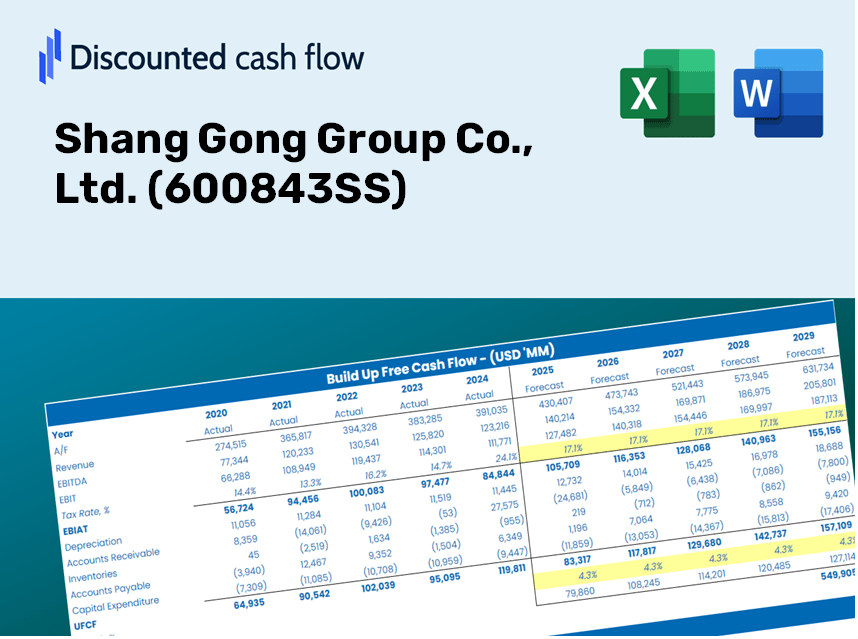
Discounted Cash Flow (DCF) - (USD MM)
| Year | AY1 2020 |
AY2 2021 |
AY3 2022 |
AY4 2023 |
AY5 2024 |
FY1 2025 |
FY2 2026 |
FY3 2027 |
FY4 2028 |
FY5 2029 |
|---|---|---|---|---|---|---|---|---|---|---|
| Revenue | 3,064.6 | 3,124.5 | 3,329.0 | 3,790.1 | 4,411.1 | 4,838.2 | 5,306.8 | 5,820.6 | 6,384.3 | 7,002.5 |
| Revenue Growth, % | 0 | 1.95 | 6.54 | 13.85 | 16.39 | 9.68 | 9.68 | 9.68 | 9.68 | 9.68 |
| EBITDA | 262.6 | 248.1 | 337.6 | 355.1 | 34.5 | 356.1 | 390.6 | 428.4 | 469.9 | 515.4 |
| EBITDA, % | 8.57 | 7.94 | 10.14 | 9.37 | 0.78112 | 7.36 | 7.36 | 7.36 | 7.36 | 7.36 |
| Depreciation | 106.3 | 106.7 | 125.9 | 135.0 | 179.2 | 177.0 | 194.2 | 213.0 | 233.6 | 256.2 |
| Depreciation, % | 3.47 | 3.42 | 3.78 | 3.56 | 4.06 | 3.66 | 3.66 | 3.66 | 3.66 | 3.66 |
| EBIT | 156.3 | 141.4 | 211.7 | 220.1 | -144.7 | 179.1 | 196.4 | 215.5 | 236.3 | 259.2 |
| EBIT, % | 5.1 | 4.52 | 6.36 | 5.81 | -3.28 | 3.7 | 3.7 | 3.7 | 3.7 | 3.7 |
| Total Cash | 1,127.6 | 1,620.2 | 1,725.4 | 1,601.8 | 1,486.8 | 2,094.4 | 2,297.3 | 2,519.7 | 2,763.7 | 3,031.4 |
| Total Cash, percent | .0 | .0 | .0 | .0 | .0 | .0 | .0 | .0 | .0 | .0 |
| Account Receivables | 683.8 | 771.8 | 931.6 | 805.7 | 1,249.9 | 1,205.6 | 1,322.4 | 1,450.4 | 1,590.9 | 1,744.9 |
| Account Receivables, % | 22.31 | 24.7 | 27.98 | 21.26 | 28.33 | 24.92 | 24.92 | 24.92 | 24.92 | 24.92 |
| Inventories | 862.5 | 997.0 | 1,076.7 | 1,142.2 | 1,272.9 | 1,464.9 | 1,606.8 | 1,762.4 | 1,933.1 | 2,120.2 |
| Inventories, % | 28.14 | 31.91 | 32.34 | 30.14 | 28.86 | 30.28 | 30.28 | 30.28 | 30.28 | 30.28 |
| Accounts Payable | 383.8 | 153.5 | 424.0 | 342.8 | 667.3 | 525.9 | 576.8 | 632.7 | 694.0 | 761.2 |
| Accounts Payable, % | 12.52 | 4.91 | 12.74 | 9.05 | 15.13 | 10.87 | 10.87 | 10.87 | 10.87 | 10.87 |
| Capital Expenditure | -166.3 | -75.0 | -87.9 | -111.0 | -114.6 | -154.8 | -169.8 | -186.2 | -204.2 | -224.0 |
| Capital Expenditure, % | -5.43 | -2.4 | -2.64 | -2.93 | -2.6 | -3.2 | -3.2 | -3.2 | -3.2 | -3.2 |
| Tax Rate, % | -18.01 | -18.01 | -18.01 | -18.01 | -18.01 | -18.01 | -18.01 | -18.01 | -18.01 | -18.01 |
| EBITAT | 98.9 | 124.4 | 108.0 | 116.6 | -170.8 | 127.3 | 139.6 | 153.1 | 167.9 | 184.2 |
| Depreciation | ||||||||||
| Changes in Account Receivables | ||||||||||
| Changes in Inventories | ||||||||||
| Changes in Accounts Payable | ||||||||||
| Capital Expenditure | ||||||||||
| UFCF | -1,123.6 | -296.6 | 177.2 | 119.6 | -356.5 | -139.7 | -43.7 | -47.9 | -52.6 | -57.7 |
| WACC, % | 6.36 | 6.51 | 6.28 | 6.29 | 6.59 | 6.41 | 6.41 | 6.41 | 6.41 | 6.41 |
| PV UFCF | ||||||||||
| SUM PV UFCF | -293.0 | |||||||||
| Long Term Growth Rate, % | 2.00 | |||||||||
| Free cash flow (T + 1) | -59 | |||||||||
| Terminal Value | -1,335 | |||||||||
| Present Terminal Value | -979 | |||||||||
| Enterprise Value | -1,272 | |||||||||
| Net Debt | 600 | |||||||||
| Equity Value | -1,871 | |||||||||
| Diluted Shares Outstanding, MM | 706 | |||||||||
| Equity Value Per Share | -2.65 |
Benefits of Using Our Model
- Flexible Forecast Inputs: Effortlessly modify assumptions (growth %, profit margins, WACC) to explore various scenarios.
- Comprehensive Data: Shang Gong Group Co., Ltd. (600843SS) financial data pre-loaded to kickstart your analysis.
- Automated DCF Calculations: The template computes Net Present Value (NPV) and intrinsic value automatically.
- Customizable and Professional Design: A refined Excel model tailored to meet your valuation requirements.
- Designed for Analysts and Investors: Perfect for assessing projections, validating strategies, and enhancing efficiency.
Key Features
- Real-Time 600843SS Data: Pre-populated with Shang Gong Group’s historical performance metrics and future growth forecasts.
- Comprehensive Input Customization: Modify parameters such as revenue growth rates, profit margins, discount rates, tax obligations, and capital investment levels.
- Interactive Valuation Framework: Automatically recalculates Net Present Value (NPV) and intrinsic value as adjustments are made to your inputs.
- Scenario Analysis: Develop various forecasting scenarios to evaluate a range of potential valuation results.
- Intuitive User Interface: Designed to be straightforward and accessible for both experienced professionals and newcomers.
How It Works
- Step 1: Download the Excel file.
- Step 2: Review the pre-loaded data for Shang Gong Group Co., Ltd. (600843SS) (historical and projected).
- Step 3: Modify key assumptions (highlighted in yellow) based on your insights.
- Step 4: Observe the automatic recalculations reflecting Shang Gong Group Co., Ltd.'s (600843SS) intrinsic value.
- Step 5: Utilize the results for your investment strategies or reporting needs.
Why Opt for This Calculator?
- Precise Analytics: Real Shang Gong Group Co., Ltd. financials guarantee dependable valuation outcomes.
- Flexible Features: Modify essential inputs like growth rates, WACC, and tax rates to align with your forecasts.
- Efficiency Boost: Built-in calculations save you the hassle of starting from the ground up.
- Professional-Quality Tool: Tailored for investors, analysts, and consultants.
- Easy to Navigate: User-friendly design and clear instructions ensure accessibility for everyone.
Who Should Utilize This Product?
- Investment Professionals: Develop comprehensive and trustworthy valuation models for analyzing portfolios featuring Shang Gong Group Co., Ltd. (600843SS).
- Corporate Financial Departments: Evaluate valuation scenarios to inform strategic decision-making within the organization.
- Consultants and Financial Advisors: Equip clients with precise valuation insights related to Shang Gong Group Co., Ltd. (600843SS).
- Students and Instructors: Leverage authentic data to practice and teach financial modeling techniques.
- Technology Aficionados: Gain insights into how companies like Shang Gong Group Co., Ltd. (600843SS) are assessed in the market.
Contents of the Template
- Operating and Balance Sheet Data: Pre-filled historical data and forecasts for Shang Gong Group Co., Ltd. (600843SS), including revenue, EBITDA, EBIT, and capital expenditures.
- WACC Calculation: A dedicated sheet for calculating Weighted Average Cost of Capital (WACC), encompassing parameters such as Beta, risk-free rate, and share price.
- DCF Valuation (Unlevered and Levered): Customizable Discounted Cash Flow models that reveal intrinsic value through detailed calculations.
- Financial Statements: Pre-loaded annual and quarterly financial statements to facilitate comprehensive analysis.
- Key Ratios: A collection of key ratios related to profitability, leverage, and efficiency for Shang Gong Group Co., Ltd. (600843SS).
- Dashboard and Charts: A visual summary of valuation outputs and assumptions, simplifying the analysis of results.
Disclaimer
All information, articles, and product details provided on this website are for general informational and educational purposes only. We do not claim any ownership over, nor do we intend to infringe upon, any trademarks, copyrights, logos, brand names, or other intellectual property mentioned or depicted on this site. Such intellectual property remains the property of its respective owners, and any references here are made solely for identification or informational purposes, without implying any affiliation, endorsement, or partnership.
We make no representations or warranties, express or implied, regarding the accuracy, completeness, or suitability of any content or products presented. Nothing on this website should be construed as legal, tax, investment, financial, medical, or other professional advice. In addition, no part of this site—including articles or product references—constitutes a solicitation, recommendation, endorsement, advertisement, or offer to buy or sell any securities, franchises, or other financial instruments, particularly in jurisdictions where such activity would be unlawful.
All content is of a general nature and may not address the specific circumstances of any individual or entity. It is not a substitute for professional advice or services. Any actions you take based on the information provided here are strictly at your own risk. You accept full responsibility for any decisions or outcomes arising from your use of this website and agree to release us from any liability in connection with your use of, or reliance upon, the content or products found herein.