
|
Shanghai Baosight Software Co.,Ltd. (600845.SS) DCF Valuation |
Fully Editable: Tailor To Your Needs In Excel Or Sheets
Professional Design: Trusted, Industry-Standard Templates
Investor-Approved Valuation Models
MAC/PC Compatible, Fully Unlocked
No Expertise Is Needed; Easy To Follow
Shanghai Baosight Software Co.,Ltd. (600845.SS) Bundle
Simplify Shanghai Baosight Software Co., Ltd. (600845SS) valuation with this customizable DCF Calculator! Featuring real Shanghai Baosight Software Co., Ltd. (600845SS) financials and adjustable forecast inputs, you can test scenarios and uncover Shanghai Baosight Software Co., Ltd. (600845SS) fair value in minutes.
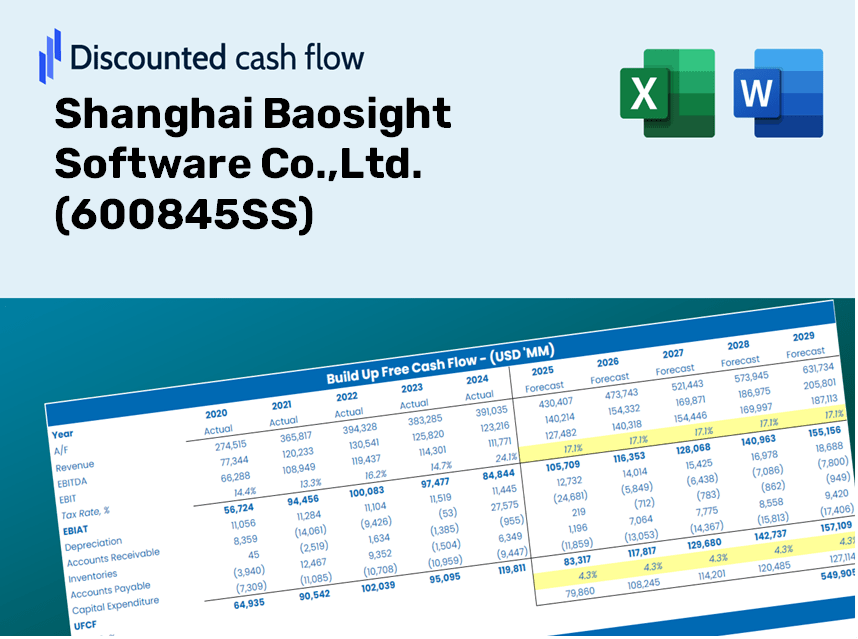
Discounted Cash Flow (DCF) - (USD MM)
| Year | AY1 2020 |
AY2 2021 |
AY3 2022 |
AY4 2023 |
AY5 2024 |
FY1 2025 |
FY2 2026 |
FY3 2027 |
FY4 2028 |
FY5 2029 |
|---|---|---|---|---|---|---|---|---|---|---|
| Revenue | 10,225.0 | 11,759.4 | 13,149.9 | 12,915.6 | 13,644.4 | 14,691.3 | 15,818.6 | 17,032.3 | 18,339.2 | 19,746.4 |
| Revenue Growth, % | 0 | 15.01 | 11.82 | -1.78 | 5.64 | 7.67 | 7.67 | 7.67 | 7.67 | 7.67 |
| EBITDA | 1,735.7 | 2,178.9 | 2,536.2 | 2,951.2 | 2,779.4 | 2,879.8 | 3,100.8 | 3,338.7 | 3,594.9 | 3,870.7 |
| EBITDA, % | 16.97 | 18.53 | 19.29 | 22.85 | 20.37 | 19.6 | 19.6 | 19.6 | 19.6 | 19.6 |
| Depreciation | 322.9 | 310.6 | 329.0 | 342.6 | 359.2 | 399.2 | 429.8 | 462.8 | 498.3 | 536.6 |
| Depreciation, % | 3.16 | 2.64 | 2.5 | 2.65 | 2.63 | 2.72 | 2.72 | 2.72 | 2.72 | 2.72 |
| EBIT | 1,412.8 | 1,868.3 | 2,207.2 | 2,608.5 | 2,420.2 | 2,480.6 | 2,671.0 | 2,875.9 | 3,096.6 | 3,334.2 |
| EBIT, % | 13.82 | 15.89 | 16.79 | 20.2 | 17.74 | 16.88 | 16.88 | 16.88 | 16.88 | 16.88 |
| Total Cash | 3,828.1 | 4,307.6 | 4,935.0 | 5,966.0 | 4,557.0 | 5,617.6 | 6,048.7 | 6,512.8 | 7,012.5 | 7,550.5 |
| Total Cash, percent | .0 | .0 | .0 | .0 | .0 | .0 | .0 | .0 | .0 | .0 |
| Account Receivables | 4,066.2 | .0 | 6,714.9 | 7,076.3 | 8,674.3 | 6,146.7 | 6,618.3 | 7,126.1 | 7,672.9 | 8,261.7 |
| Account Receivables, % | 39.77 | 0 | 51.06 | 54.79 | 63.57 | 41.84 | 41.84 | 41.84 | 41.84 | 41.84 |
| Inventories | 2,917.0 | 3,062.3 | 3,147.8 | 3,523.8 | 2,723.3 | 3,694.8 | 3,978.3 | 4,283.6 | 4,612.3 | 4,966.2 |
| Inventories, % | 28.53 | 26.04 | 23.94 | 27.28 | 19.96 | 25.15 | 25.15 | 25.15 | 25.15 | 25.15 |
| Accounts Payable | 2,281.7 | 2,795.2 | 3,564.5 | 3,576.2 | 4,562.3 | 3,946.6 | 4,249.4 | 4,575.5 | 4,926.6 | 5,304.6 |
| Accounts Payable, % | 22.31 | 23.77 | 27.11 | 27.69 | 33.44 | 26.86 | 26.86 | 26.86 | 26.86 | 26.86 |
| Capital Expenditure | -628.2 | -761.8 | -300.9 | -376.2 | -436.7 | -617.7 | -665.1 | -716.2 | -771.1 | -830.3 |
| Capital Expenditure, % | -6.14 | -6.48 | -2.29 | -2.91 | -3.2 | -4.2 | -4.2 | -4.2 | -4.2 | -4.2 |
| Tax Rate, % | 9.5 | 9.5 | 9.5 | 9.5 | 9.5 | 9.5 | 9.5 | 9.5 | 9.5 | 9.5 |
| EBITAT | 1,211.4 | 1,687.8 | 2,011.2 | 2,361.9 | 2,190.2 | 2,223.9 | 2,394.5 | 2,578.2 | 2,776.0 | 2,989.0 |
| Depreciation | ||||||||||
| Changes in Account Receivables | ||||||||||
| Changes in Inventories | ||||||||||
| Changes in Accounts Payable | ||||||||||
| Capital Expenditure | ||||||||||
| UFCF | -3,795.4 | 5,671.0 | -3,991.8 | 1,602.7 | 2,301.3 | 2,945.6 | 1,706.9 | 1,837.8 | 1,978.9 | 2,130.7 |
| WACC, % | 4.52 | 4.52 | 4.52 | 4.52 | 4.52 | 4.52 | 4.52 | 4.52 | 4.52 | 4.52 |
| PV UFCF | ||||||||||
| SUM PV UFCF | 9,355.6 | |||||||||
| Long Term Growth Rate, % | 3.50 | |||||||||
| Free cash flow (T + 1) | 2,205 | |||||||||
| Terminal Value | 215,402 | |||||||||
| Present Terminal Value | 172,652 | |||||||||
| Enterprise Value | 182,008 | |||||||||
| Net Debt | -3,709 | |||||||||
| Equity Value | 185,717 | |||||||||
| Diluted Shares Outstanding, MM | 2,882 | |||||||||
| Equity Value Per Share | 64.44 |
What You Will Receive
- Authentic BAOSIGHT Financials: Access to historical and forecasted data for precise valuation.
- Customizable Parameters: Adjust WACC, tax rates, revenue growth, and capital expenditures to your needs.
- Automated Calculations: Intrinsic value and NPV are computed in real-time.
- Scenario Testing: Evaluate various scenarios to assess the future performance of Shanghai Baosight Software Co., Ltd. (600845SS).
- User-Friendly Interface: Designed for professionals while remaining accessible for newcomers.
Key Features
- Authentic Financial Data: Gain access to reliable pre-loaded historical figures and future forecasts for Shanghai Baosight Software Co., Ltd. (600845SS).
- Flexible Projection Assumptions: Modify highlighted cells including WACC, growth rates, and profit margins to suit your analysis.
- Real-Time Calculations: Enjoy automatic updates for DCF, Net Present Value (NPV), and cash flow metrics.
- Interactive Dashboard: Utilize clear charts and summaries to easily visualize your valuation insights.
- Designed for All Users: An intuitive and straightforward layout tailored for investors, CFOs, and consultants alike.
How It Works
- Step 1: Download the Excel file for Shanghai Baosight Software Co., Ltd. (600845SS).
- Step 2: Review the pre-filled financial data and forecasts specific to Shanghai Baosight.
- Step 3: Adjust key inputs such as revenue growth, WACC, and tax rates (highlighted cells).
- Step 4: Observe the DCF model refresh in real-time as you modify the assumptions.
- Step 5: Evaluate the outputs and leverage the findings for your investment strategies.
Why Opt for This Calculator?
- Designed for Experts: A sophisticated tool tailored for analysts, CFOs, and consultants.
- Authentic Data: Preloaded financials for Shanghai Baosight Software Co., Ltd. (600845SS) to ensure precision.
- Scenario Analysis: Effortlessly test various forecasts and assumptions.
- Transparent Results: Automatically computes intrinsic value, NPV, and essential metrics.
- User-Friendly: Step-by-step guidance to facilitate your calculations.
Who Can Benefit from Our Software?
- Software Developers: Enhance your coding skills by utilizing advanced development tools.
- IT Professionals: Integrate industry-leading solutions into your projects or research initiatives.
- Business Analysts: Validate your hypotheses and assess software performance using our analytical tools for Shanghai Baosight Software Co., Ltd. (600845SS).
- Project Managers: Optimize your project workflows with our user-friendly, customizable software solutions.
- Entrepreneurs: Discover best practices for analyzing software companies like Shanghai Baosight Software Co., Ltd. (600845SS).
Contents of the Template
- Operating and Balance Sheet Data: Pre-filled historical data and forecasts for Shanghai Baosight Software Co., Ltd. (600845SS), including revenue, EBITDA, EBIT, and capital expenditures.
- WACC Calculation: A dedicated sheet for Weighted Average Cost of Capital (WACC), featuring parameters such as Beta, risk-free rate, and share price.
- DCF Valuation (Unlevered and Levered): Editable Discounted Cash Flow models that provide intrinsic value along with detailed calculations.
- Financial Statements: Pre-loaded annual and quarterly financial statements for comprehensive analysis.
- Key Ratios: A collection of profitability, leverage, and efficiency ratios specifically for Shanghai Baosight Software Co., Ltd. (600845SS).
- Dashboard and Charts: A visual summary of valuation outputs and assumptions to facilitate easy analysis of results.
Disclaimer
All information, articles, and product details provided on this website are for general informational and educational purposes only. We do not claim any ownership over, nor do we intend to infringe upon, any trademarks, copyrights, logos, brand names, or other intellectual property mentioned or depicted on this site. Such intellectual property remains the property of its respective owners, and any references here are made solely for identification or informational purposes, without implying any affiliation, endorsement, or partnership.
We make no representations or warranties, express or implied, regarding the accuracy, completeness, or suitability of any content or products presented. Nothing on this website should be construed as legal, tax, investment, financial, medical, or other professional advice. In addition, no part of this site—including articles or product references—constitutes a solicitation, recommendation, endorsement, advertisement, or offer to buy or sell any securities, franchises, or other financial instruments, particularly in jurisdictions where such activity would be unlawful.
All content is of a general nature and may not address the specific circumstances of any individual or entity. It is not a substitute for professional advice or services. Any actions you take based on the information provided here are strictly at your own risk. You accept full responsibility for any decisions or outcomes arising from your use of this website and agree to release us from any liability in connection with your use of, or reliance upon, the content or products found herein.