
|
Lihuayi Weiyuan Chemical Co., Ltd. (600955.SS) DCF Valuation |
Fully Editable: Tailor To Your Needs In Excel Or Sheets
Professional Design: Trusted, Industry-Standard Templates
Investor-Approved Valuation Models
MAC/PC Compatible, Fully Unlocked
No Expertise Is Needed; Easy To Follow
Lihuayi Weiyuan Chemical Co., Ltd. (600955.SS) Bundle
Discover the true value of Lihuayi Weiyuan Chemical Co., Ltd. (600955SS) with our advanced DCF Calculator! Adjust key assumptions, explore various scenarios, and evaluate how changes affect the valuation of Lihuayi Weiyuan Chemical Co., Ltd. (600955SS) – all within a user-friendly Excel template.
Discounted Cash Flow (DCF) - (USD MM)
| Year | AY1 2020 |
AY2 2021 |
AY3 2022 |
AY4 2023 |
AY5 2024 |
FY1 2025 |
FY2 2026 |
FY3 2027 |
FY4 2028 |
FY5 2029 |
|---|---|---|---|---|---|---|---|---|---|---|
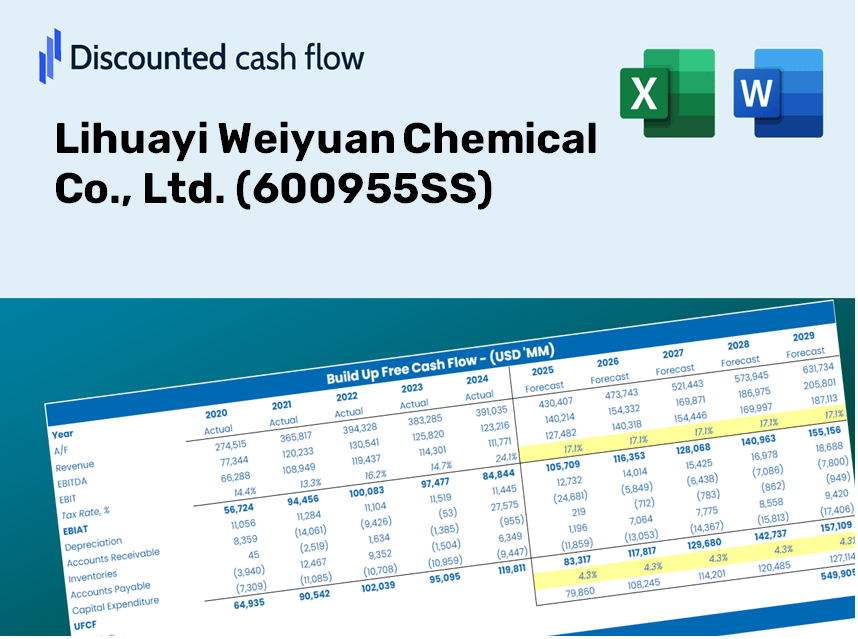
| Revenue | 4,386.4 | 9,634.6 | 7,798.1 | 7,050.2 | 9,522.1 | 12,055.2 | 15,262.1 | 19,322.2 | 24,462.3 | 30,969.8 |
| Revenue Growth, % | 0 | 119.65 | -19.06 | -9.59 | 35.06 | 26.6 | 26.6 | 26.6 | 26.6 | 26.6 |
| EBITDA | 1,377.1 | 3,276.7 | 1,207.9 | 564.4 | 845.9 | 2,357.6 | 2,984.8 | 3,778.8 | 4,784.0 | 6,056.7 |
| EBITDA, % | 31.39 | 34.01 | 15.49 | 8.01 | 8.88 | 19.56 | 19.56 | 19.56 | 19.56 | 19.56 |
| Depreciation | 348.6 | 396.9 | 413.2 | 448.9 | 752.2 | 762.7 | 965.6 | 1,222.4 | 1,547.6 | 1,959.3 |
| Depreciation, % | 7.95 | 4.12 | 5.3 | 6.37 | 7.9 | 6.33 | 6.33 | 6.33 | 6.33 | 6.33 |
| EBIT | 1,028.5 | 2,879.8 | 794.7 | 115.5 | 93.8 | 1,594.9 | 2,019.2 | 2,556.4 | 3,236.4 | 4,097.4 |
| EBIT, % | 23.45 | 29.89 | 10.19 | 1.64 | 0.98463 | 13.23 | 13.23 | 13.23 | 13.23 | 13.23 |
| Total Cash | 243.9 | 4,765.4 | 2,668.3 | 922.4 | 894.6 | 2,693.5 | 3,410.0 | 4,317.2 | 5,465.7 | 6,919.7 |
| Total Cash, percent | .0 | .0 | .0 | .0 | .0 | .0 | .0 | .0 | .0 | .0 |
| Account Receivables | 25.0 | 15.5 | .0 | 4.9 | 3.8 | 20.3 | 25.7 | 32.5 | 41.2 | 52.1 |
| Account Receivables, % | 0.57061 | 0.16132 | 0.000609121701 | 0.06961007 | 0.0395731 | 0.16834 | 0.16834 | 0.16834 | 0.16834 | 0.16834 |
| Inventories | 327.4 | 309.2 | 372.3 | 428.6 | 589.5 | 668.3 | 846.0 | 1,071.1 | 1,356.1 | 1,716.8 |
| Inventories, % | 7.46 | 3.21 | 4.77 | 6.08 | 6.19 | 5.54 | 5.54 | 5.54 | 5.54 | 5.54 |
| Accounts Payable | 369.3 | 303.2 | 613.4 | 1,463.7 | 1,301.4 | 1,298.6 | 1,644.0 | 2,081.3 | 2,635.0 | 3,336.0 |
| Accounts Payable, % | 8.42 | 3.15 | 7.87 | 20.76 | 13.67 | 10.77 | 10.77 | 10.77 | 10.77 | 10.77 |
| Capital Expenditure | -646.1 | -965.1 | -3,041.4 | -4,382.9 | -1,468.8 | -3,407.8 | -4,314.4 | -5,462.1 | -6,915.1 | -8,754.7 |
| Capital Expenditure, % | -14.73 | -10.02 | -39 | -62.17 | -15.42 | -28.27 | -28.27 | -28.27 | -28.27 | -28.27 |
| Tax Rate, % | 0.83831 | 0.83831 | 0.83831 | 0.83831 | 0.83831 | 0.83831 | 0.83831 | 0.83831 | 0.83831 | 0.83831 |
| EBITAT | 776.5 | 2,165.9 | 612.7 | 109.1 | 93.0 | 1,344.3 | 1,701.9 | 2,154.6 | 2,727.7 | 3,453.4 |
| Depreciation | ||||||||||
| Changes in Account Receivables | ||||||||||
| Changes in Inventories | ||||||||||
| Changes in Accounts Payable | ||||||||||
| Capital Expenditure | ||||||||||
| UFCF | 495.8 | 1,559.3 | -1,752.9 | -3,035.8 | -945.7 | -1,399.0 | -1,484.7 | -1,879.6 | -2,379.7 | -3,012.7 |
| WACC, % | 6.09 | 6.08 | 6.1 | 6.27 | 6.32 | 6.17 | 6.17 | 6.17 | 6.17 | 6.17 |
| PV UFCF | ||||||||||
| SUM PV UFCF | -8,311.3 | |||||||||
| Long Term Growth Rate, % | 2.00 | |||||||||
| Free cash flow (T + 1) | -3,073 | |||||||||
| Terminal Value | -73,669 | |||||||||
| Present Terminal Value | -54,607 | |||||||||
| Enterprise Value | -62,918 | |||||||||
| Net Debt | 2,050 | |||||||||
| Equity Value | -64,968 | |||||||||
| Diluted Shares Outstanding, MM | 566 | |||||||||
| Equity Value Per Share | -114.81 |
What You Will Receive
- Authentic Lihuayi Financial Data: Access to both historical and projected figures for precise valuation.
- Customizable Parameters: Adjust WACC, tax rates, revenue growth, and capital expenditure inputs.
- Automated Calculations: Dynamic computation of intrinsic value and NPV.
- Scenario Evaluation: Examine various scenarios to assess Lihuayi's potential future performance.
- User-Friendly Interface: Designed for industry experts but easy to navigate for newcomers.
Key Features
- Pre-Loaded Data: Lihuayi Weiyuan Chemical Co., Ltd.'s historical financial statements and pre-filled forecasts.
- Fully Adjustable Inputs: Modify WACC, tax rates, revenue growth, and EBITDA margins to suit your analysis.
- Instant Results: Witness real-time recalculations of Lihuayi Weiyuan Chemical's intrinsic value.
- Clear Visual Outputs: Dashboard charts effectively showcase valuation results and essential metrics.
- Built for Accuracy: A reliable tool designed for analysts, investors, and finance professionals.
How It Functions
- Download the Template: Gain immediate access to the Excel-based Lihuayi Weiyuan Chemical Co., Ltd. (600955SS) DCF Calculator.
- Input Your Assumptions: Modify the yellow-highlighted cells for growth rates, WACC, margins, and additional parameters.
- Instant Calculations: The model automatically recalculates the intrinsic value of Lihuayi Weiyuan Chemical Co., Ltd. (600955SS).
- Test Scenarios: Experiment with various assumptions to assess potential changes in valuation.
- Analyze and Decide: Utilize the findings to inform your investment choices or financial evaluations.
Why Select This Calculator for Lihuayi Weiyuan Chemical Co., Ltd. (600955SS)?
- All-in-One Solution: Features DCF, WACC, and in-depth financial ratio analyses all in a single tool.
- Flexible Inputs: Modify the highlighted yellow cells to explore different financial scenarios.
- In-Depth Analysis: Automatically computes Lihuayi Weiyuan's intrinsic value and Net Present Value.
- Preloaded Information: Comes with historical and projected data to provide precise initial insights.
- High-Quality Standards: Perfect for financial analysts, investors, and business advisors.
Who Can Benefit from Our Product?
- Institutional Investors: Develop comprehensive and trustworthy valuation models for asset management.
- Finance Departments: Evaluate valuation scenarios to shape corporate strategies.
- Financial Consultants: Deliver precise valuation analysis for Lihuayi Weiyuan Chemical Co., Ltd. (600955SS) to clients.
- Students and Instructors: Leverage real-world data to enhance financial modeling skills in educational settings.
- Chemical Industry Analysts: Gain insights into how companies like Lihuayi Weiyuan Chemical Co., Ltd. (600955SS) are valued in the marketplace.
Contents of the Template
- Pre-Filled DCF Model: Lihuayi Weiyuan Chemical Co., Ltd.’s financial data preloaded for immediate analysis.
- WACC Calculator: Comprehensive calculations for Weighted Average Cost of Capital tailored for [600955SS].
- Financial Ratios: Assess Lihuayi Weiyuan’s profitability, leverage, and operational efficiency.
- Editable Inputs: Modify assumptions such as growth rates, profit margins, and CAPEX to suit your projections.
- Financial Statements: Access annual and quarterly reports for in-depth examination.
- Interactive Dashboard: Effortlessly visualize critical valuation metrics and outcomes.
Disclaimer
All information, articles, and product details provided on this website are for general informational and educational purposes only. We do not claim any ownership over, nor do we intend to infringe upon, any trademarks, copyrights, logos, brand names, or other intellectual property mentioned or depicted on this site. Such intellectual property remains the property of its respective owners, and any references here are made solely for identification or informational purposes, without implying any affiliation, endorsement, or partnership.
We make no representations or warranties, express or implied, regarding the accuracy, completeness, or suitability of any content or products presented. Nothing on this website should be construed as legal, tax, investment, financial, medical, or other professional advice. In addition, no part of this site—including articles or product references—constitutes a solicitation, recommendation, endorsement, advertisement, or offer to buy or sell any securities, franchises, or other financial instruments, particularly in jurisdictions where such activity would be unlawful.
All content is of a general nature and may not address the specific circumstances of any individual or entity. It is not a substitute for professional advice or services. Any actions you take based on the information provided here are strictly at your own risk. You accept full responsibility for any decisions or outcomes arising from your use of this website and agree to release us from any liability in connection with your use of, or reliance upon, the content or products found herein.