
|
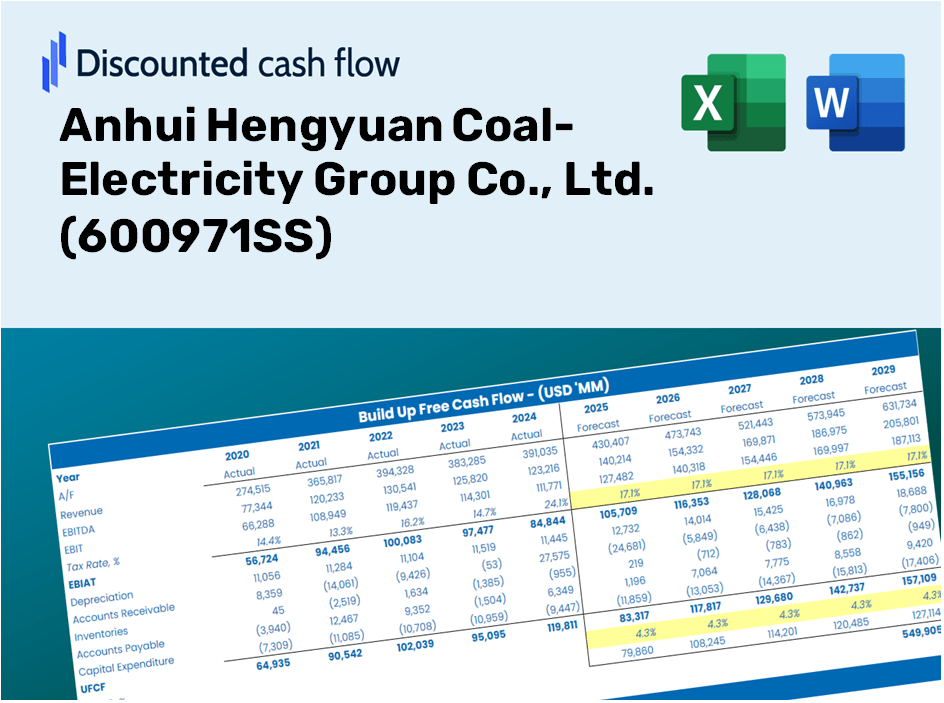
Anhui Hengyuan Coal-Electricity Group Co., Ltd. (600971.SS) DCF Valuation |
Fully Editable: Tailor To Your Needs In Excel Or Sheets
Professional Design: Trusted, Industry-Standard Templates
Investor-Approved Valuation Models
MAC/PC Compatible, Fully Unlocked
No Expertise Is Needed; Easy To Follow
Anhui Hengyuan Coal-Electricity Group Co., Ltd. (600971.SS) Bundle
Explore the financial outlook of Anhui Hengyuan Coal-Electricity Group Co., Ltd. (600971SS) with our user-friendly DCF Calculator! Enter your projections for growth, margins, and expenses to calculate the intrinsic value of Anhui Hengyuan Coal-Electricity Group Co., Ltd. (600971SS) and enhance your investment approach.
Discounted Cash Flow (DCF) - (USD MM)
| Year | AY1 2020 |
AY2 2021 |
AY3 2022 |
AY4 2023 |
AY5 2024 |
FY1 2025 |
FY2 2026 |
FY3 2027 |
FY4 2028 |
FY5 2029 |
|---|---|---|---|---|---|---|---|---|---|---|
| Revenue | 5,209.9 | 6,749.4 | 8,386.1 | 7,785.9 | 6,972.5 | 6,645.5 | 6,333.8 | 6,036.8 | 5,753.7 | 5,483.8 |
| Revenue Growth, % | 0 | 29.55 | 24.25 | -7.16 | -10.45 | -4.69 | -4.69 | -4.69 | -4.69 | -4.69 |
| EBITDA | 1,563.8 | 2,254.5 | 3,568.1 | 2,930.1 | 2,029.3 | 2,295.4 | 2,187.8 | 2,085.2 | 1,987.4 | 1,894.2 |
| EBITDA, % | 30.02 | 33.4 | 42.55 | 37.63 | 29.1 | 34.54 | 34.54 | 34.54 | 34.54 | 34.54 |
| Depreciation | 609.4 | 663.1 | 691.2 | 707.5 | 739.0 | 657.2 | 626.4 | 597.0 | 569.0 | 542.4 |
| Depreciation, % | 11.7 | 9.82 | 8.24 | 9.09 | 10.6 | 9.89 | 9.89 | 9.89 | 9.89 | 9.89 |
| EBIT | 954.4 | 1,591.4 | 2,876.9 | 2,222.6 | 1,290.3 | 1,638.2 | 1,561.3 | 1,488.1 | 1,418.3 | 1,351.8 |
| EBIT, % | 18.32 | 23.58 | 34.31 | 28.55 | 18.51 | 24.65 | 24.65 | 24.65 | 24.65 | 24.65 |
| Total Cash | 5,513.3 | 6,242.6 | 7,442.9 | 7,049.9 | 5,947.9 | 6,075.3 | 5,790.3 | 5,518.8 | 5,260.0 | 5,013.3 |
| Total Cash, percent | .0 | .0 | .0 | .0 | .0 | .0 | .0 | .0 | .0 | .0 |
| Account Receivables | 2,107.1 | 2,681.1 | 3,123.8 | 2,317.6 | 1,344.7 | 2,212.5 | 2,108.8 | 2,009.9 | 1,915.6 | 1,825.8 |
| Account Receivables, % | 40.44 | 39.72 | 37.25 | 29.77 | 19.29 | 33.29 | 33.29 | 33.29 | 33.29 | 33.29 |
| Inventories | 302.6 | 494.5 | 476.7 | 352.6 | 235.2 | 355.2 | 338.5 | 322.6 | 307.5 | 293.1 |
| Inventories, % | 5.81 | 7.33 | 5.68 | 4.53 | 3.37 | 5.34 | 5.34 | 5.34 | 5.34 | 5.34 |
| Accounts Payable | 773.5 | 1,120.7 | 1,410.5 | 1,316.7 | 1,801.7 | 1,209.8 | 1,153.0 | 1,099.0 | 1,047.4 | 998.3 |
| Accounts Payable, % | 14.85 | 16.6 | 16.82 | 16.91 | 25.84 | 18.2 | 18.2 | 18.2 | 18.2 | 18.2 |
| Capital Expenditure | -405.2 | -539.5 | -919.8 | -1,214.7 | -1,034.2 | -759.9 | -724.2 | -690.3 | -657.9 | -627.0 |
| Capital Expenditure, % | -7.78 | -7.99 | -10.97 | -15.6 | -14.83 | -11.43 | -11.43 | -11.43 | -11.43 | -11.43 |
| Tax Rate, % | 15.7 | 15.7 | 15.7 | 15.7 | 15.7 | 15.7 | 15.7 | 15.7 | 15.7 | 15.7 |
| EBITAT | 801.7 | 1,417.6 | 2,488.8 | 1,987.5 | 1,087.7 | 1,419.7 | 1,353.1 | 1,289.6 | 1,229.2 | 1,171.5 |
| Depreciation | ||||||||||
| Changes in Account Receivables | ||||||||||
| Changes in Inventories | ||||||||||
| Changes in Accounts Payable | ||||||||||
| Capital Expenditure | ||||||||||
| UFCF | -630.3 | 1,122.4 | 2,125.2 | 2,316.8 | 2,367.8 | -262.7 | 1,319.0 | 1,257.1 | 1,198.2 | 1,142.0 |
| WACC, % | 5.49 | 5.52 | 5.5 | 5.52 | 5.49 | 5.5 | 5.5 | 5.5 | 5.5 | 5.5 |
| PV UFCF | ||||||||||
| SUM PV UFCF | 3,847.1 | |||||||||
| Long Term Growth Rate, % | 0.50 | |||||||||
| Free cash flow (T + 1) | 1,148 | |||||||||
| Terminal Value | 22,936 | |||||||||
| Present Terminal Value | 17,546 | |||||||||
| Enterprise Value | 21,393 | |||||||||
| Net Debt | -4,123 | |||||||||
| Equity Value | 25,516 | |||||||||
| Diluted Shares Outstanding, MM | 1,204 | |||||||||
| Equity Value Per Share | 21.18 |
What You Will Receive
- Authentic 600971SS Financial Data: Comprehensive historical and projected data for precise valuation.
- Customizable Parameters: Adjust WACC, tax rates, revenue growth, and capital expenditures according to your needs.
- Instant Calculations: Automatic computation of intrinsic value and NPV in real-time.
- Scenario Evaluation: Assess various scenarios to analyze Anhui Hengyuan Coal-Electricity Group’s future outlook.
- User-Friendly and Professional Layout: Designed for industry experts while remaining easy to navigate for newcomers.
Key Features
- Pre-Loaded Data: Comprehensive financial statements and forecasts for Anhui Hengyuan Coal-Electricity Group Co., Ltd. (600971SS).
- Fully Adjustable Inputs: Customize WACC, tax rates, revenue growth, and EBITDA margins to fit your analysis.
- Instant Results: View the intrinsic value of Anhui Hengyuan Coal-Electricity Group Co., Ltd. (600971SS) update in real time.
- Clear Visual Outputs: Interactive dashboard charts present valuation outcomes and critical metrics.
- Built for Accuracy: A professional-grade tool tailored for analysts, investors, and finance professionals.
How It Works
- Step 1: Download the Excel file.
- Step 2: Review Anhui Hengyuan Coal-Electricity Group Co., Ltd.'s (600971SS) pre-filled financial data and forecasts.
- Step 3: Modify key inputs such as revenue growth, WACC, and tax rates (highlighted cells).
- Step 4: Observe the DCF model update in real-time as you adjust assumptions.
- Step 5: Analyze the outputs and leverage the results for your investment decisions.
Why Opt for This Calculator?
- Designed for Experts: A sophisticated tool utilized by analysts, CFOs, and consultants.
- Comprehensive Data: Anhui Hengyuan Coal-Electricity Group Co., Ltd.’s historical and projected financials integrated for precision.
- Forecast Simulation: Effortlessly model various scenarios and assumptions.
- Insightful Results: Instantly calculates intrinsic value, NPV, and essential metrics.
- User-Friendly: Detailed instructions guide you through each step of the process.
Who Can Benefit from This Product?
- Investors: Assess the valuation of Anhui Hengyuan Coal-Electricity Group Co., Ltd. (600971SS) before making buying or selling decisions.
- CFOs and Financial Analysts: Optimize valuation workflows and evaluate financial forecasts.
- Startup Founders: Gain insights into the valuation strategies of major public companies like Anhui Hengyuan Coal-Electricity Group Co., Ltd. (600971SS).
- Consultants: Provide clients with comprehensive and professional valuation reports.
- Students and Educators: Utilize real-world data to practice and teach valuation methods.
Contents of the Template
- Pre-Filled Data: Contains Anhui Hengyuan Coal-Electricity Group Co., Ltd.'s historical financial data and projections.
- Discounted Cash Flow Model: An editable DCF valuation model with automated calculations.
- Weighted Average Cost of Capital (WACC): A dedicated worksheet for calculating WACC using customized inputs.
- Key Financial Ratios: Evaluate Anhui Hengyuan's profitability, operational efficiency, and financial leverage.
- Customizable Inputs: Easily modify revenue growth rates, profit margins, and tax assumptions.
- User-Friendly Dashboard: Visual representations and tables summarizing essential valuation metrics.
Disclaimer
All information, articles, and product details provided on this website are for general informational and educational purposes only. We do not claim any ownership over, nor do we intend to infringe upon, any trademarks, copyrights, logos, brand names, or other intellectual property mentioned or depicted on this site. Such intellectual property remains the property of its respective owners, and any references here are made solely for identification or informational purposes, without implying any affiliation, endorsement, or partnership.
We make no representations or warranties, express or implied, regarding the accuracy, completeness, or suitability of any content or products presented. Nothing on this website should be construed as legal, tax, investment, financial, medical, or other professional advice. In addition, no part of this site—including articles or product references—constitutes a solicitation, recommendation, endorsement, advertisement, or offer to buy or sell any securities, franchises, or other financial instruments, particularly in jurisdictions where such activity would be unlawful.
All content is of a general nature and may not address the specific circumstances of any individual or entity. It is not a substitute for professional advice or services. Any actions you take based on the information provided here are strictly at your own risk. You accept full responsibility for any decisions or outcomes arising from your use of this website and agree to release us from any liability in connection with your use of, or reliance upon, the content or products found herein.