
|
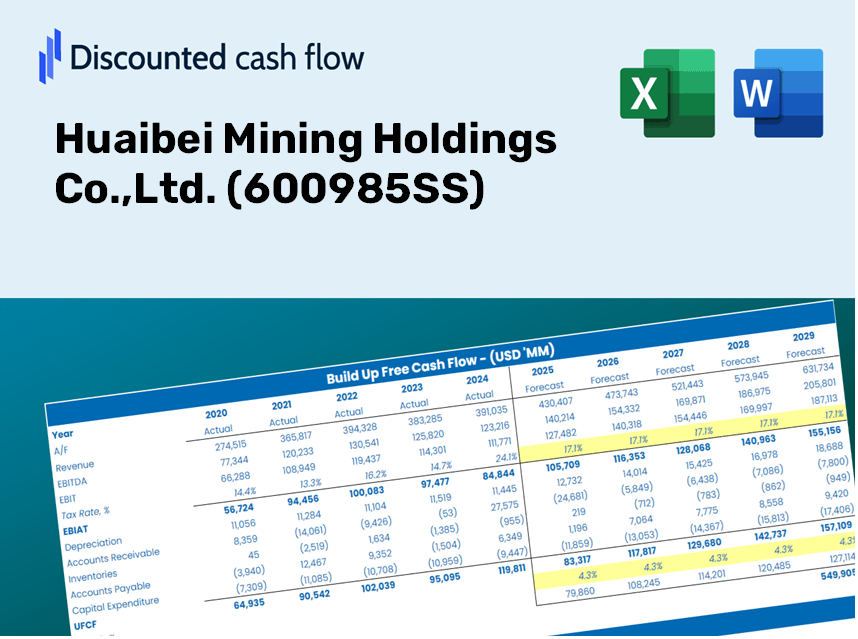
Huaibei Mining Holdings Co.,Ltd. (600985.SS) DCF Valuation |
Fully Editable: Tailor To Your Needs In Excel Or Sheets
Professional Design: Trusted, Industry-Standard Templates
Investor-Approved Valuation Models
MAC/PC Compatible, Fully Unlocked
No Expertise Is Needed; Easy To Follow
Huaibei Mining Holdings Co.,Ltd. (600985.SS) Bundle
Simplify Huaibei Mining Holdings Co., Ltd. valuation with this customizable DCF Calculator! Featuring real Huaibei Mining Holdings Co., Ltd. financials and adjustable forecast inputs, you can test scenarios and uncover Huaibei Mining Holdings Co., Ltd. fair value in minutes.
Discounted Cash Flow (DCF) - (USD MM)
| Year | AY1 2020 |
AY2 2021 |
AY3 2022 |
AY4 2023 |
AY5 2024 |
FY1 2025 |
FY2 2026 |
FY3 2027 |
FY4 2028 |
FY5 2029 |
|---|---|---|---|---|---|---|---|---|---|---|
| Revenue | 52,369.5 | 65,038.2 | 69,224.8 | 73,387.5 | 65,875.0 | 70,223.5 | 74,859.1 | 79,800.7 | 85,068.4 | 90,684.0 |
| Revenue Growth, % | 0 | 24.19 | 6.44 | 6.01 | -10.24 | 6.6 | 6.6 | 6.6 | 6.6 | 6.6 |
| EBITDA | 7,611.2 | 9,790.7 | 13,121.6 | 12,221.8 | 9,499.7 | 11,182.0 | 11,920.1 | 12,707.0 | 13,545.8 | 14,440.0 |
| EBITDA, % | 14.53 | 15.05 | 18.96 | 16.65 | 14.42 | 15.92 | 15.92 | 15.92 | 15.92 | 15.92 |
| Depreciation | 2,473.9 | 2,908.1 | 4,320.8 | 4,421.0 | 3,659.6 | 3,794.4 | 4,044.9 | 4,311.9 | 4,596.5 | 4,900.0 |
| Depreciation, % | 4.72 | 4.47 | 6.24 | 6.02 | 5.56 | 5.4 | 5.4 | 5.4 | 5.4 | 5.4 |
| EBIT | 5,137.3 | 6,882.5 | 8,800.8 | 7,800.8 | 5,840.1 | 7,387.6 | 7,875.2 | 8,395.1 | 8,949.3 | 9,540.0 |
| EBIT, % | 9.81 | 10.58 | 12.71 | 10.63 | 8.87 | 10.52 | 10.52 | 10.52 | 10.52 | 10.52 |
| Total Cash | 4,246.5 | 5,683.2 | 10,843.3 | 8,651.7 | 5,358.0 | 7,364.1 | 7,850.3 | 8,368.5 | 8,920.9 | 9,509.8 |
| Total Cash, percent | .0 | .0 | .0 | .0 | .0 | .0 | .0 | .0 | .0 | .0 |
| Account Receivables | 6,884.4 | 6,021.1 | 5,727.8 | 5,247.7 | 4,325.5 | 6,235.1 | 6,646.7 | 7,085.4 | 7,553.1 | 8,051.7 |
| Account Receivables, % | 13.15 | 9.26 | 8.27 | 7.15 | 6.57 | 8.88 | 8.88 | 8.88 | 8.88 | 8.88 |
| Inventories | 1,512.6 | 2,532.3 | 2,774.5 | 2,899.6 | 3,086.7 | 2,728.4 | 2,908.5 | 3,100.5 | 3,305.2 | 3,523.4 |
| Inventories, % | 2.89 | 3.89 | 4.01 | 3.95 | 4.69 | 3.89 | 3.89 | 3.89 | 3.89 | 3.89 |
| Accounts Payable | 5,042.7 | 9,738.0 | 5,026.3 | 11,689.7 | 13,663.2 | 9,625.2 | 10,260.6 | 10,937.9 | 11,659.9 | 12,429.6 |
| Accounts Payable, % | 9.63 | 14.97 | 7.26 | 15.93 | 20.74 | 13.71 | 13.71 | 13.71 | 13.71 | 13.71 |
| Capital Expenditure | -5,535.8 | -5,472.4 | -7,160.5 | -8,003.7 | -8,559.3 | -7,475.7 | -7,969.2 | -8,495.3 | -9,056.0 | -9,653.8 |
| Capital Expenditure, % | -10.57 | -8.41 | -10.34 | -10.91 | -12.99 | -10.65 | -10.65 | -10.65 | -10.65 | -10.65 |
| Tax Rate, % | 10.22 | 10.22 | 10.22 | 10.22 | 10.22 | 10.22 | 10.22 | 10.22 | 10.22 | 10.22 |
| EBITAT | 4,153.6 | 5,589.2 | 7,472.3 | 6,881.6 | 5,243.3 | 6,278.9 | 6,693.4 | 7,135.2 | 7,606.2 | 8,108.3 |
| Depreciation | ||||||||||
| Changes in Account Receivables | ||||||||||
| Changes in Inventories | ||||||||||
| Changes in Accounts Payable | ||||||||||
| Capital Expenditure | ||||||||||
| UFCF | -2,262.5 | 7,563.7 | -27.9 | 10,317.3 | 3,052.1 | -2,991.7 | 2,812.7 | 2,998.4 | 3,196.3 | 3,407.3 |
| WACC, % | 5.81 | 5.82 | 5.87 | 5.91 | 5.94 | 5.87 | 5.87 | 5.87 | 5.87 | 5.87 |
| PV UFCF | ||||||||||
| SUM PV UFCF | 7,316.9 | |||||||||
| Long Term Growth Rate, % | 0.50 | |||||||||
| Free cash flow (T + 1) | 3,424 | |||||||||
| Terminal Value | 63,783 | |||||||||
| Present Terminal Value | 47,958 | |||||||||
| Enterprise Value | 55,275 | |||||||||
| Net Debt | 390 | |||||||||
| Equity Value | 54,886 | |||||||||
| Diluted Shares Outstanding, MM | 2,683 | |||||||||
| Equity Value Per Share | 20.46 |
What You Will Receive
- Genuine 600985SS Financial Data: Pre-filled with Huaibei Mining Holdings' historical and projected data for accurate analysis.
- Completely Customizable Template: Easily adjust key inputs like revenue growth, WACC, and EBITDA %.
- Instantaneous Calculations: Witness Huaibei Mining's intrinsic value update in real-time as you make changes.
- Expert Valuation Tool: Tailored for investors, analysts, and consultants in search of precise DCF results.
- Intuitive Design: Streamlined layout and clear instructions suitable for users of all skill levels.
Key Features
- Comprehensive HMH Financial Data: Equipped with Huaibei Mining's historical financial performance and future projections.
- Customizable Parameters: Tailor inputs for revenue growth, profit margins, WACC, tax rates, and capital spending.
- Dynamic Valuation Framework: Automatic recalculations of Net Present Value (NPV) and intrinsic value based on your modifications.
- Scenario Analysis: Develop various forecasting scenarios to evaluate different valuation results.
- User-Centric Interface: Intuitive and organized, suitable for both seasoned professionals and newcomers.
How It Works
- 1. Access the Template: Download and open the Excel file containing Huaibei Mining Holdings Co.,Ltd.'s preloaded data.
- 2. Adjust Assumptions: Modify key parameters such as growth rates, WACC, and capital expenditures.
- 3. View Results in Real Time: The DCF model automatically computes intrinsic value and NPV as you make adjustments.
- 4. Experiment with Scenarios: Evaluate various forecasts to explore different valuation results.
- 5. Present with Assurance: Share expert valuation insights to bolster your decision-making process.
Why Opt for This Calculator?
- Precision: Leverages actual financial data from Huaibei Mining Holdings Co., Ltd. for reliable results.
- Versatility: Crafted for users to easily experiment and adjust parameters as needed.
- Efficiency: Eliminate the tedious process of creating a DCF model from the ground up.
- Expert-Level: Built with the accuracy and functionality expected at the CFO level.
- Intuitive Design: Accessible for everyone, regardless of their financial modeling expertise.
Who Should Utilize This Product?
- Investors: Assess the valuation of Huaibei Mining Holdings Co., Ltd. (600985SS) before making investment decisions.
- CFOs and Financial Analysts: Optimize valuation processes and validate financial forecasts.
- Startup Founders: Gain insights into how leading companies like Huaibei Mining are valued by the market.
- Consultants: Provide clients with comprehensive and accurate valuation reports.
- Students and Educators: Utilize current market data to practice and teach valuation methods effectively.
Contents of the Template
- Comprehensive DCF Model: An editable template featuring detailed valuation calculations.
- Real-World Data: Huaibei Mining Holdings Co., Ltd.’s historical and projected financials preloaded for analysis.
- Customizable Parameters: Modify WACC, growth rates, and tax assumptions to explore various scenarios.
- Financial Statements: Complete annual and quarterly breakdowns for enhanced insights.
- Key Ratios: Embedded analysis for assessing profitability, efficiency, and leverage.
- Dashboard with Visual Outputs: Graphs and tables for clear and actionable results.
Disclaimer
All information, articles, and product details provided on this website are for general informational and educational purposes only. We do not claim any ownership over, nor do we intend to infringe upon, any trademarks, copyrights, logos, brand names, or other intellectual property mentioned or depicted on this site. Such intellectual property remains the property of its respective owners, and any references here are made solely for identification or informational purposes, without implying any affiliation, endorsement, or partnership.
We make no representations or warranties, express or implied, regarding the accuracy, completeness, or suitability of any content or products presented. Nothing on this website should be construed as legal, tax, investment, financial, medical, or other professional advice. In addition, no part of this site—including articles or product references—constitutes a solicitation, recommendation, endorsement, advertisement, or offer to buy or sell any securities, franchises, or other financial instruments, particularly in jurisdictions where such activity would be unlawful.
All content is of a general nature and may not address the specific circumstances of any individual or entity. It is not a substitute for professional advice or services. Any actions you take based on the information provided here are strictly at your own risk. You accept full responsibility for any decisions or outcomes arising from your use of this website and agree to release us from any liability in connection with your use of, or reliance upon, the content or products found herein.